
Fig. 3.
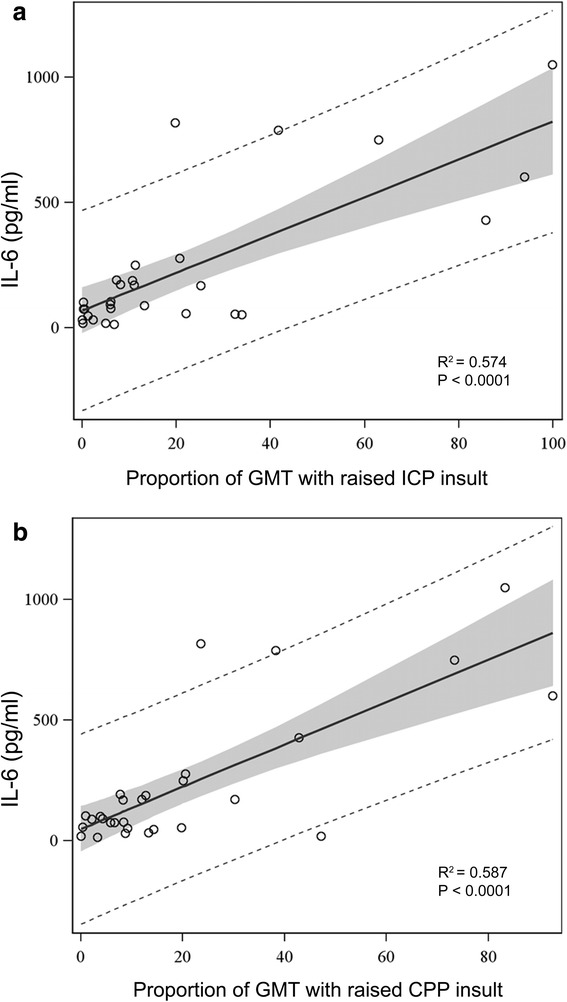
Linear regression analysis between median plasma levels of IL-6 and proportion of raised ICP a and low CPP b insults. Insults are expressed as proportion of good monitoring time (GMT). Grey shadow represents 95 % confidence limits. Dotted lines represent 95 % prediction limits. ICP intracranial pressure, CPP cerebral perfusion pressure