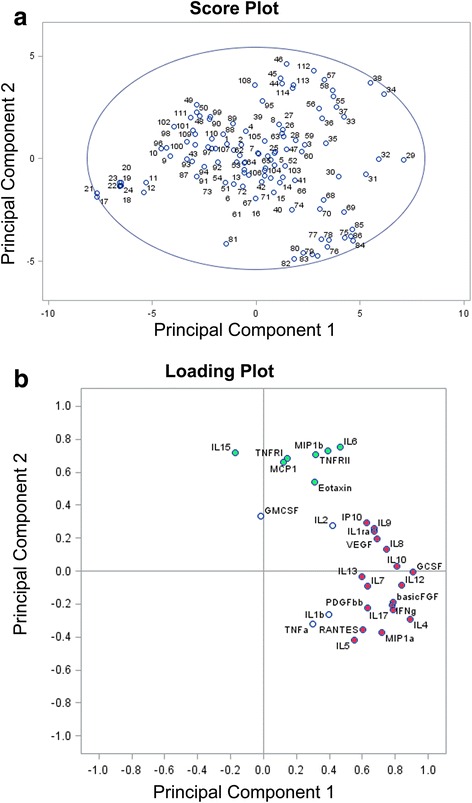
Fig. 5.

Panel a: Scores plot shows the scores on each principal component for each observation. The ellipse on the plot (Hotelling ellipse) is the 95 % CI for the model. b Loading plot shows the cytokines which load on the respective principal components. Cytokines which better explain Principal Components 1 and 2 are marked in red and green, respectively
