
Fig. 2.
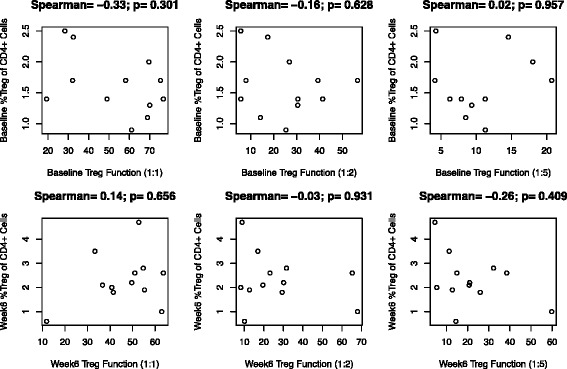
Association between circulating Treg frequency and Treg function (% Treg function, pre- and post-treatment). Baseline phenotypic (baseline circulating Treg cells) and suppressive function at each ratio (baseline %Treg function; top row), and post treatment measures (bottom row) were tested across patients for correlations. There was no significant association (p values on each part). Fewer than 18 data points were generated due to missing values on some patients