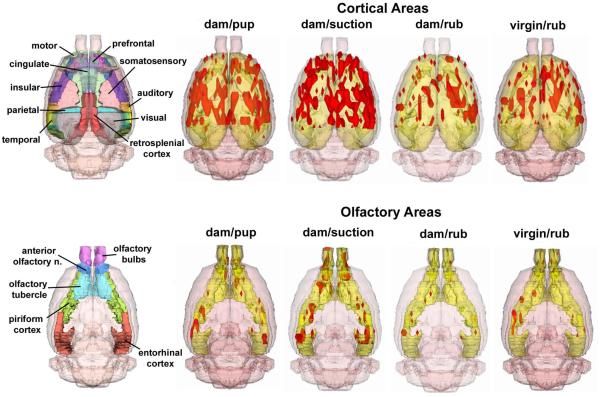
Figure 2.
Three-dimensional composite maps of positive BOLD activation in lactating and virgin rats. Data are shown for the cortical mantle (upper row) and olfactory system areas (lower row). The four stimulus conditions are the same as in Figure 1. Areas in red are volumes of positive BOLD activity. Segmented 3D atlas brains to the left show various regions of interest.

