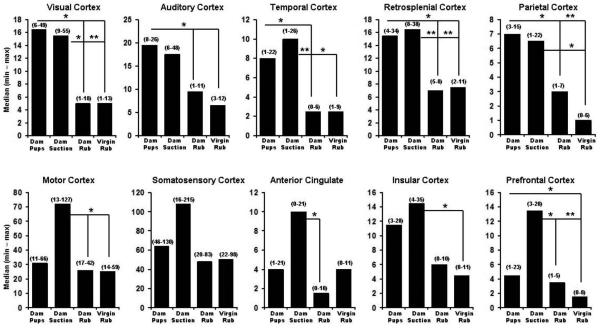
Figure 3.
Number of positive BOLD voxels in subregions of the cortex of lactating and virgin rats. The four stimulus conditions for each panel are the same as in Figure 1. Data are expressed as median (minimum-maximum). Statistical tests were done with Newman-Keuls multiple comparisons test. * indicates q0.05, 23, 4 > 2.8, p < 0.05; ** indicates q0.05, 23, 4 > 3.7, p < 0.01.

