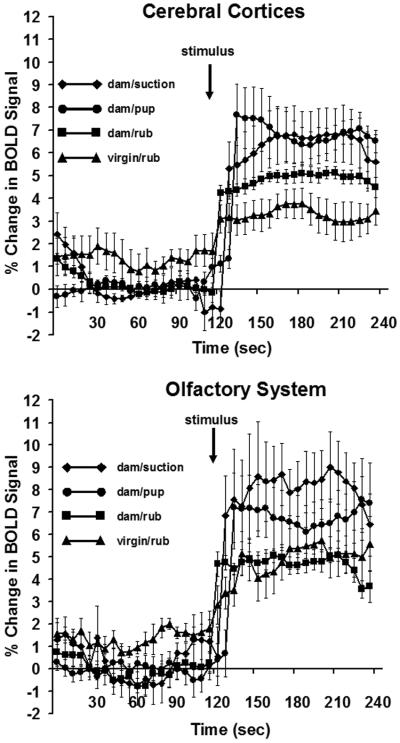
Figure 4.
Positive BOLD signal changes over time in lactating and virgin rats. Data for the cortical mantle and olfactory system areas are shown as mean ± standard error of the mean. The four stimulus conditions are the same as in Figure 1. Arrow indicates the point of stimulus presentation during the course of the scans (suckling pups, artificial suction, or mechanical rubbing of ventrum). Statistical comparisons were done with a repeated measures analysis of variance (p < 0.05).

