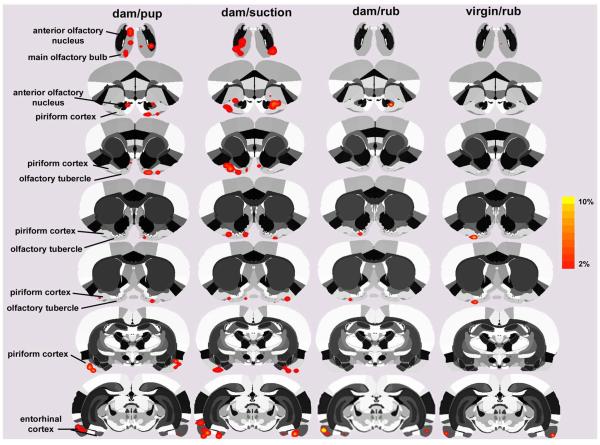
Figure 5.
Two-dimensional compositive maps of positive BOLD activation in olfactory areas of lactating and virgin rats. The four stimulus conditions are the same as in Figure 1. Scale bar hue (orange-to-yellow) indicates percent increase in BOLD with a lower threshold cut-off of 2%. Various olfactory regions of interest are highlighted to the left of the figure.

