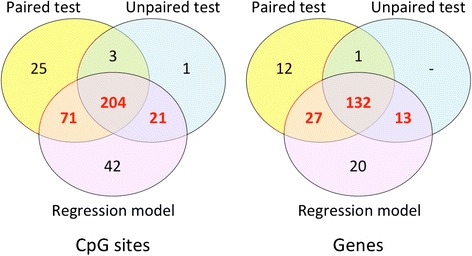
Fig. 6.

CpG sites used for functional enrichment analysis. Only the CpGs that have a DNAm difference at least 10 % in IUGR twins were considered. A set of 296 CpGs (numbers in red) was selected as the sites that were identified by limma regression analysis after accounting for confounding effects and also passed at least one of the non-parametric tests for IUGR association. The right Venn diagram shows the number of genes matching each criteria of significance, where 172 genes comprise the set tested for functional enrichment
