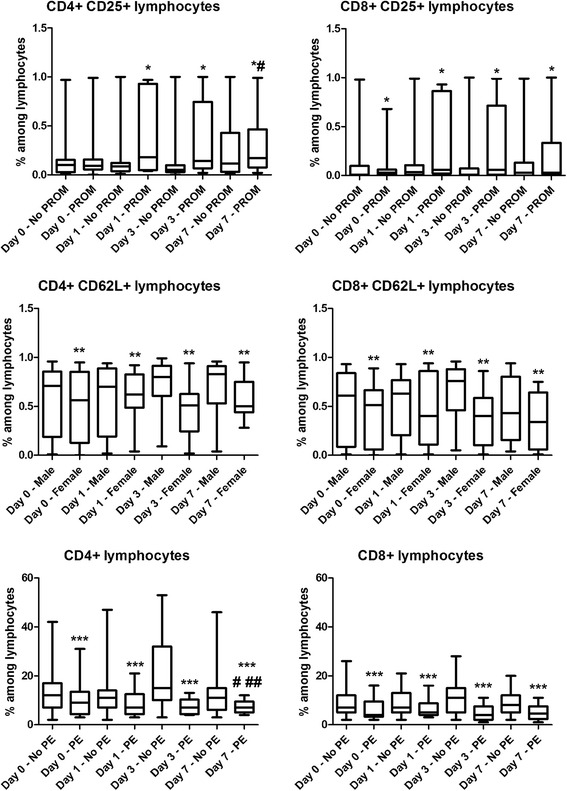
Fig. 2.

Box-plots representing frequency values of the investigated cell subsets in different subgroups of preterm infants at birth (Day 0) and on days 1, 3 and 7 of life. Horizontal line: median, box: interquartile range, whisker: range. PE – preeclampsia, PROM – premature rupture of membranes. *p < 0.05 vs. No PROM, **p < 0.05 vs. Male infants, ***p < 0.05 vs. No PE, #p < 0.05 vs. Day 0, ##p < 0.05 vs. Day 0
