Fig. 1.

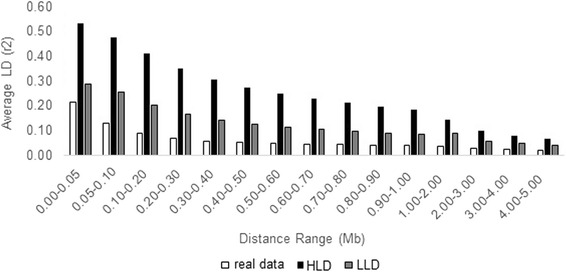
Linkage disequilibrium (LD) decay of real data and two simulated populations (HLD and LLD). Average LD, expressed in r2, according to varying distances between markers (Mb)

Linkage disequilibrium (LD) decay of real data and two simulated populations (HLD and LLD). Average LD, expressed in r2, according to varying distances between markers (Mb)