Abstract
Electrochemical microelectrodes are commonly used to record amperometric spikes of current that result from oxidation of transmitter released from individual vesicles during exocytosis. Whereas the exquisite sensitivity of these measurements is well appreciated, a better understanding of the noise sources that limit the resolution of the technique is needed to guide the design of next-generation devices. We measured the current power spectral density (SI) of electrochemical microelectrodes to understand the physical basis of dominant noise sources and to determine how noise varies with the electrode material and geometry. We find that the current noise is thermal in origin in that SI is proportional to the real part of the admittance of the electrode. The admittance of microelectrodes is well described by a constant phase element model such that both the real and imaginary admittance increase with frequency raised to a power of 0.84 – 0.96. Our results demonstrate that the current standard deviation is proportional to the square root of the area of the working electrode, increases ~linearly with the bandwidth of the recording, and varies with the choice of the electrode material with Au ≈ carbon fiber > nitrogen-doped diamond-like carbon > indium-tin-oxide. Contact between a cell and a microelectrode does not appreciably increase noise. Surface-patterned microchip electrodes can have a noise performance that is superior to that of carbon-fiber microelectrodes of the same area.
Introduction
Transmitter is released from neurons and endocrine cells by the process of exocytosis as transmitter-laden vesicles fuse with the plasma membrane and release their contents into the extracellular space. Measuring transmitter release from individual vesicles (quantal exocytosis) with high time resolution is essential to develop and test mechanistic models of exocytosis and endocytosis. A powerful technique for measuring quantal exocytosis is carbon-fiber amperometry, which measures spikes of current as the transmitter released from individual vesicles is oxidized on the surface of the electrode1. Analysis of amperometric spikes reveals the time course of release and quantal content, and can resolve zeptomoles2 of released transmitter with millisecond temporal resolution (reviewed in3). A feature of interest in amperometric measurement of exocytosis is the “foot signal” that constitutes the initial flux of transmitter through a fusion pore4–5. It is desirable to resolve small changes in the amplitude of this ~ pA signal because it is related to fusion pore conductance. The lifetime of the foot is used as a measure of the lifetime of the fusion pore, but the onset of the foot signal is difficult to resolve, and is usually defined as the time when the current exceeds some multiple of the baseline standard deviation noise6. “Stand alone” foot signals have been reported to result from fusion pore closure without full release5, 7, but it is difficult to unequivocally identify these signals without the accompanying current “spike” because the signal-to-noise ratio is small. Therefore, measurement noise limits the information that can be extracted from electrochemical assays of quantal exocytosis.
Our group and others have been developing microchip multi-electrode arrays in order to facilitate higher throughput measurements of exocytosis as well as to enable measurements that are not possible with carbon-fiber electrodes8–22. Compared to fabrication methods using carbon fibers, microchip fabrication approaches using photolithography have the potential for much better control of electrode areas as well as surface properties, and offer a wider choice of electrode and insulation materials and insulation geometry. Therefore microchip approaches have the potential to not only offer higher throughput, but also higher performance measurements of quantal exocytosis compared to conventional carbon-fiber microelectrodes. A thorough understanding of noise sources, however, is necessary to guide the design of both the devices and the experiments that employ them.
Experimental section
Fabrication of electrochemical microelectrodes
Carbon-fiber microelectrodes, schematically illustrated in Fig. 1, were purchased from ALA Scientific (Farmingdale, NY) and were fabricated as described by Schulte and Chow23. Electrode measurements were always performed using freshly cut fibers. Noise measurements were also made from insulated carbon fibers immersed in the usual electrolyte solution before cutting in order to determine the “background” capacitance and noise.
Fig. 1.
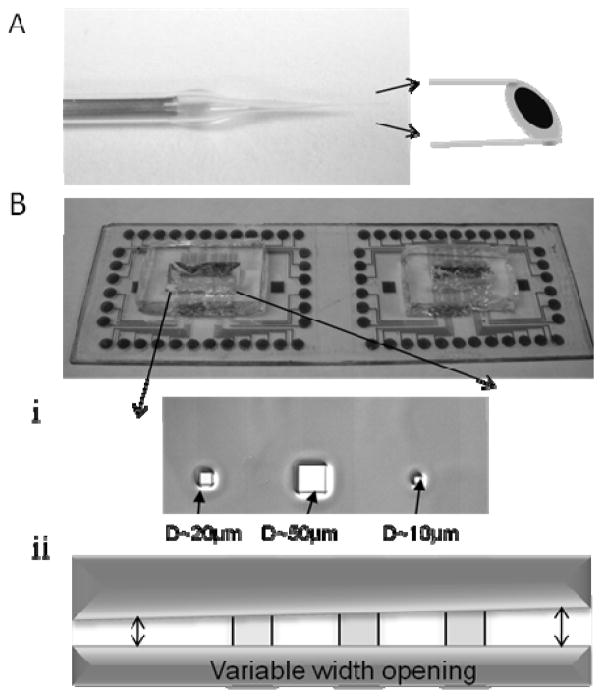
Depiction of the electrochemical microelectrodes used in this study. A. Carbon-fiber microelectrode insulated with poly(acrylic–carboxylic acid) and glass and cut to yield a disk-shaped working electrode with a diameter of either 5 or 8 μm. B. Planar electrodes fabricated from Au, ITO or DLC:N using photolithography on a glass substrate. Openings in the SU8 photoresist insulation define the working electrodes. i. Square openings with dimensions of 5, 10, 20 and 50 μm were used or ii. A variable-width slot opening in the photoresist allowed electrodes of various areas to be tested.
Planar microelectrodes were fabricated using photolithography on a glass slide substrate (25 x 75 x 1 mm). Either Indium-Tin-Oxide (ITO), Au, or nitrogen-doped diamond-like carbon (DLC:N) were used as the electrode materials. Fabrication methods are described in the Supporting Information.
The area of the working electrodes was varied using two approaches. In one approach square openings with dimensions of 5, 10, 20 and 50 μm were patterned using a hard mask (Cornell Nanofabrication Facility, Ithaca, NY) as depicted in Fig. 1Bi. In order to vary electrode area over a larger range, we also fabricated devices where a variable width opening (~5 to 50 μm) in the photoresist that intersected the conductive stripes at a right angle (Fig. 1Bii). The area of each electrode was measured from photomicrographs. In some experiments the conductive film was completely covered with the insulating film (“mock electrodes”) in order to obtain background capacitance and noise values.
We found that it is important to first confirm the electrochemical activity of all electrodes tested in order to obtain consistent results. Sample cyclic voltammograms with the test analyte ferricyanide (Fe(CN)63−) are presented in the Supporting Information (Fig. S-1).
Current Power Spectral Density (PSD) measurements
Current was measured using the EPC-10 two-electrode potentiostat (HEKA Electronik, Lambrecht, Germany). Except as indicated, noise measurements were performed at the high gain range (50 GΩ feedback resistor) in order to minimize the noise contributed by the amplifier. The detailed methods for measuring the PSD and electrode admittance can be found in the Supporting Information.
The electrolyte solution used for noise measurements was a standard bath solution for cell recording consisting of (in mM): 150 NaCl, 5 KCl, 5 CaCl2, 2 MgCl2, 10 glucose, 10 HEPES titrated to pH 7.2 with NaOH. All chemicals were purchased from Sigma (Sigma Aldrich, St. Louis, MO, USA) unless otherwise indicated.
Results and discussion
Power Spectral Density (PSD) measurements indicate that the noise originates from the working area of the electrode, but not the double-layer capacitance
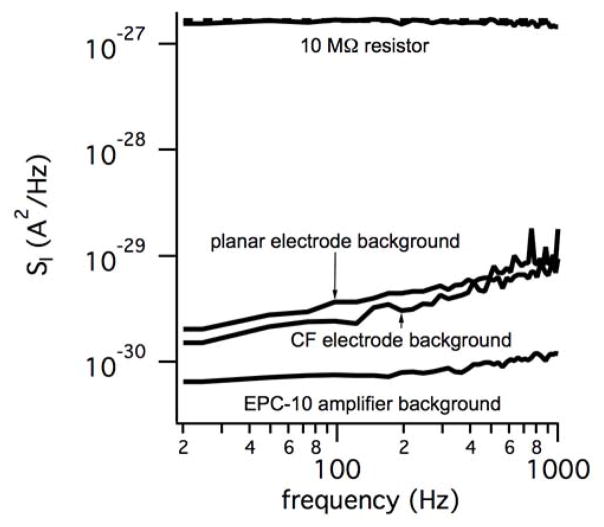
We computed the PSD for current recordings in order to understand how fluctuations vary with frequency. The PSD is a measurement of the signal power distribution in the frequency domain and is defined as the Fourier Transform of the autocorrelation of the time domain data. Use of the PSD also allowed us to unequivocally separate out line interference (60 Hz and harmonics in the US) from the intrinsic random noise of the electrode device. Background PSDs were measured for mock electrodes that lacked opening in the insulation in order to isolate the noise originating from the working electrode. Fig. 2 presents background PSDs for such a mock planar electrode and a mock carbon fiber (CF) electrode. The background PSD for an EPC-10 (50 GΩ feedback resistor) with an open probe input is also shown for comparison. In order to confirm the calibration of the PSD and the frequency response of the amplifier, we carried out measurements with a 10 MΩ resistor attached to the amplifier probe input. The Johnson-Nyquist thermal current noise of a resistor R has a PSD given by:
| (1) |
where k is Boltzmann’s constant and T is the absolute temperature. Thus Eq. 1 predicts the current PSD for a 10 MΩ resistor is frequency independent (spectrally white) with a magnitude of ~1.6x10⁻²⁷ A2/Hz at room temperature (dashed line). It is evident from Fig. 2 that the measured PSD for a 10 MΩ resistor is in excellent agreement with theory. In addition, the background noise of the EPC-10 amplifier, when set to the high-gain range, is well below the background noise of covered electrochemical electrodes, therefore the amplifier is not the dominant noise source. Note the background noise levels of the covered electrodes are similar despite the fundamental differences in fabrication methods.
Fig. 2.
Current Power Spectral Density (PSD) measurements indicate that the background noise of sham (insulation covered) electrodes is similar for photolithographically defined planar electrodes and carbon fibers electrodes. The background noise of the EPC-10 amplifier when used at a high gain (50 mV/pA, 50 GΩ feedback resistor) is smaller than the background noise of the sham electrodes. The dashed line represents the theoretical PSD for a 10 MΩ resistor whereas the upper solid trace is the measured PSD for a 10 MΩ resistor.
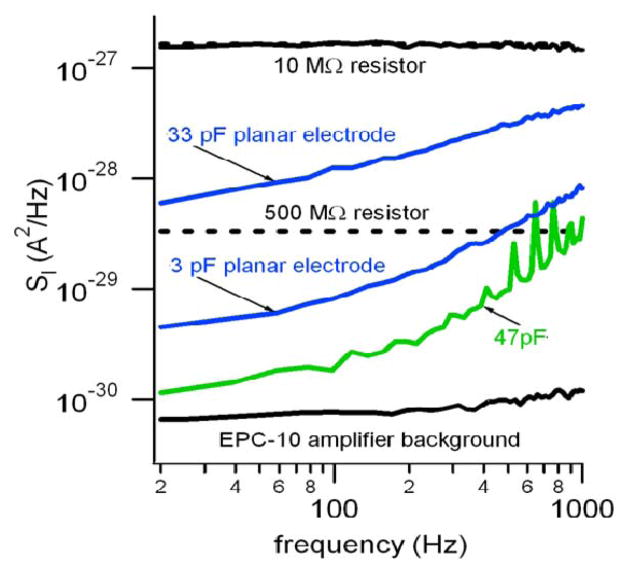
Fig. 3 presents sample PSDs for two planar ITO electrodes with areas of ~39 μm2 and 430 μm2 and double-layer capacitances (measured at a frequency of 1 kHz) of 3pF and 33 pF, respectively. Note that the PSD increases with frequency for both electrode sizes, but the PSD for the larger electrode is an order of magnitude greater. Nevertheless, the PSD for the smaller electrode is still much larger than the covered sham electrode, therefore the majority of the noise originates from the surface of the working electrode, as previously observed for CF electrodes by Schulte and Chow23.
Fig. 3.
Larger electrodes have a larger current PSD, but the noise does not originate from capacitive loading of the potentiostat. Lower black trace is the open-input noise of the EPC-10 potentiostat (50 GΩ feedback resistor) whereas the green trace is the PSD when the input of the amplifier is loaded with a 47 pF capacitor. The upper blue trace is the PSD from a ~430 μm2, 33 pF ITO electrode whereas the lower blue trace is from a ~39 μm2, 3 pF ITO electrode. The 33 pF electrode has much higher noise than the 47 pF discrete capacitor which demonstrates that capacitive loading of the amplifier is not the dominant noise source. The dashed lines depict the theoretical thermal noise of 10 MΩ and 500 MΩ resistors for comparison.
The observations that the PSD scales with the area of the electrode and increases with frequency are consistent with the possibility that the noise is related to the double-layer capacitance of the working electrode. Capacitive loading of the potentiostat (Ci) is expected to lead to frequency dependent current noise PSD (SI, enCi)24. Fluctuations in the input voltage of the amplifier (en) are coupled to the capacitance of the working electrode, leading to frequency-dependent current noise power spectral density given by:
| (2) |
A low-noise amplifier has an en value of ~3–5 nV/Hz1/2 24, therefore application of Eq. 2 predicts that instrument input voltage noise is negligible because, over the frequency range of interest, it contributes a much smaller current noise than a μm-scale electrochemical electrode. In order to confirm this experimentally, we attached a 47 pF capacitor to the probe input of the EPC-10 potentiostat and measured the current PSD. The PSD showed a steep dependence on frequency as expected (Fig. 3, green trace), yet was smaller than the noise of an electrochemical electrode with a smaller capacitance (~ 33 pF, upper blue trace) over a frequency range up to several kHz. Therefore the capacitance of a small electrochemical electrode per se does not account for the dependence of current noise on the area of the working electrode. Nevertheless, capacitive loading noise can be a dominant noise source for electrochemical electrodes with areas substantially larger than what are generally used for recording quantal exocytosis (> ~ 3000 μm2, see Supporting Information and references.10, 25
The dominant noise source for amperometric measurements from electrochemical microelectrodes is thermal noise originating from the electrode-electrolyte interface
The data from Fig. 3 demonstrate that the dominant noise source originates from the area of the working electrode and increases with frequency. We carried out experiments to determine if the noise is thermal in origin. If the frequency-dependent complex admittance of a circuit element is Y(f), a general expression for the current PSD due to thermal motion of charges (SI,th) at equilibrium is given by the Johnson-Nyquist expression:
| (3) |
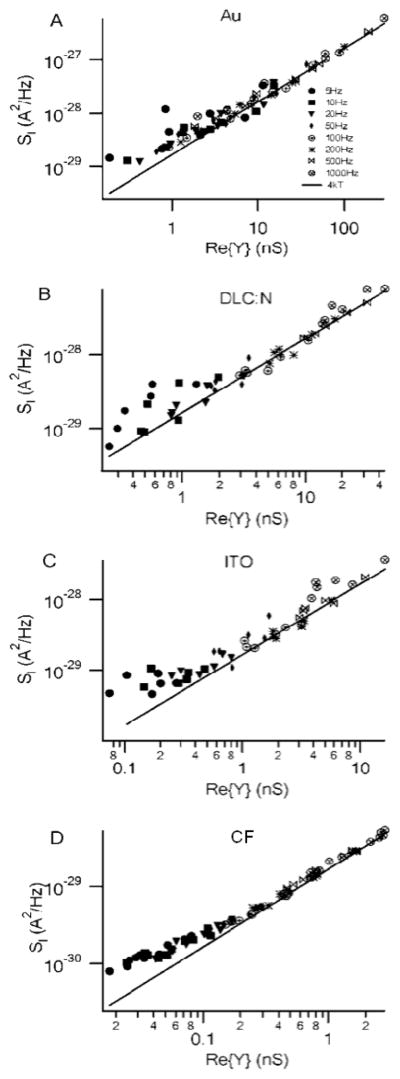
where ReY(f) is the real part of the complex admittance. We measured current PSDs from planar electrodes as well as from CF electrodes. We also measured the admittance from the same set of electrodes at frequencies ranging from 5 Hz to 1 kHz and carefully corrected for phase shifts introduced by the amplifier26. Fig. 4 presents data from the four microelectrode types plotting measured SI versus the real part of the admittance with the solid line indicating 4kT, i.e., the expected relationship if the current noise is thermal in origin as described in Eq. 3. It is evident that the data follow the theoretical relationship from Eq. 3 very well over a wide range of frequencies. The relationship also holds over a range of electrode sizes, although deviations due to the background “noise floor” are evident for the smaller CF electrodes measured at low frequencies. Similar results are obtained for dc potentials of either 600 mV or 0 mV (data not shown). These results clearly demonstrate that the dominant source of current noise for both planar electrodes and CF electrodes is thermal in origin if the electrodes are carefully fabricated and shielded and low-noise amplifiers are employed. We next sought to identify an appropriate equivalent circuit for the electrode so that we can understand the determinants of the admittance, and thus the noise.
Fig. 4.
Electrode noise is thermal in origin under careful recording conditions. Plots of the current PSD versus the real part of the admittance measured using a sinusoidal voltage at the indicated frequencies with a dc potential of 600 mV. The solid line is 4kT, the expected relationship if the noise is thermal in origin. The planar electrodes had various areas whereas the CF electrodes had a diameter of ~8 μm a mean area of ~97 μm2 (estimated from capacitance measurements). A. Au electrode B. DLC:N electrode C. ITO electrode and D. CF electrode.
The equivalent circuit for electrochemical microelectrodes consists of a Constant Phase Element (CPE) admittance with a series resistance
The admittance of the electrode / electrolyte interface can be empirically modelled as a “Constant Phase Element” (CPE) 27–28 with an admittance given by:
| (4) |
where CCPE is a constant related to the double-layer capacitance that scales with the active surface area of the working electrode, j is the imaginary unit (−1)1/2 and ω is the angular frequency = 2πf. The CPE exponent α reflects the surface characteristics of the electrode and has an ideal value of 1.0 for mercury drop electrodes and single crystal gold electrodes, whereas values as low as 0.5 are possible for highly porous electrodes27. Note that the phase of YCPE is α90° and does not depend on frequency, which is why it is called a constant phase element. Because the α parameter sets the relative magnitude of the real admittance, it is a major determinant of noise with an ideal value of 1.0 in which case the real component of the admittance (and thermal noise) goes to zero. A number of physical processes at the electrode -electrolyte interface can produce an admittance that can be approximated by Eq. 4 including surface roughness or porosity, adsorption of ions or molecular heterogeneities on the electrode surface and a non-uniform current distribution on the electrode27. The CPE admittance described by Eq. 4 can also be viewed as a frequency-dependent capacitance, so this phenomenon is also called “capacitance dispersion”. In the time domain, a CPE model is consistent with “capacitive” currents that decay with a complex time course ranging from microseconds to tens of seconds in response to a step change in electrode potential29.
Microelectrodes also have a resistance in series (Rs) with the electrode admittance. The primary source of the series resistance of a microelectrode is that all the current must pass through a small volume of electrolyte solution near the microelectrode surface. For a circular disk electrode of radius a on an infinite, insulating plane, this “spreading resistance” is given by:
| (5) |
where ρ is the resistivity of the solution, which is ~ 0.7 Ω-m for physiological (mammalian) extracellular solution. Therefore a disk electrode with a diameter of 10 μm has a spreading resistance of ~ 35 kΩ. A poorly conductive electrode material or high-resistance connection to the potentiostat also can increase the total series resistance.
Finally, the insulated area of the electrode in contact with the grounded electrolyte solution leads to a capacitance (Cins) in parallel to the series combination of Rs and YCPE. Ideally, Cins only contributes an imaginary component to the admittance of the equivalent circuit and therefore does not add any thermal noise. In reality, the insulation will have a dielectric loss factor that will contribute a real admittance and noise, however, our measurements with sham (covered) electrodes (Fig. 2) demonstrate that this noise source is relatively small for the insulation materials used in this study. We measured the admittance of Cins using sham electrodes and subtracted it from the electrode admittance, therefore Cins is ignored in subsequent analysis.
The series combination of Rs and YCPE results in a total admittance given by:
| (6) |
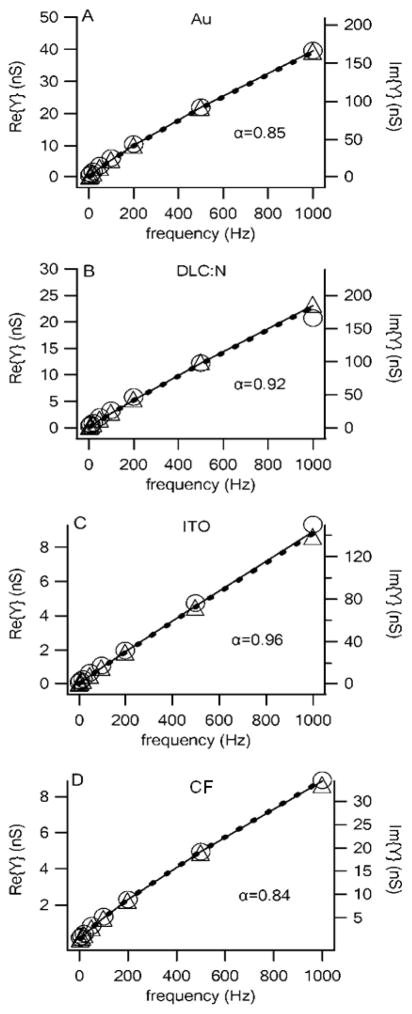
Under our common recording conditions ωαRsCCPE ≪ 1, in which case the series resistance contributes little to the total admittance and Eq. 6 is approximately equal to Eq. 4. In this case both the Real part and Imaginary part of the admittance are expected to increase in parallel with fα where α is slightly less than 1.
Fig. 5 presents the real (circles) and imaginary (triangles) admittance as a function of frequency for Au, DLC and ITO planar electrodes as well as for CF electrodes. Each data point represents the average for five to seven electrodes of the indicated type. The solid line is the real admittance and the dashed line is the imaginary admittance obtained from the least-square fit of Eq. 6 to the data yielding the value of α given in each panel. The real axis (left) and imaginary axis (right) were scaled to illustrate how the ratio of the real to imaginary admittance, and thus the phase, was approximately constant over the entire frequency range. It is clear from Fig. 5 that the CPE model is an excellent fit to the admittance of electrochemical microelectrodes fabricated from several different materials and applies to both the CF electrodes and planar electrodes.
Fig. 5.
The impedance of electrochemical electrodes fabricated from a number of materials is well described by a constant-phase-element model. The real (circles, left axis) and imaginary (triangles, right axis) admittances are plotted versus frequency for Au, DLC:N and ITO planar electrodes with mean areas of 365, 384 and 285 μm2, respectively, whereas the CF microelectrodes had a mean area of 69 μm2 (areas estimated from capacitance measurements). The admittances represent average values from seven (DLC:N), six (Au) or five (ITO and CF) electrodes. The fits to the CPE model are the solid curve (real admittance) and dashed curve (imaginary admittance). Since fits were not very sensitive to Rs, Rs was set to a value of zero. The “background” admittance with electrodes covered with insulation was subtracted in each case.
A comparison between the electrode materials reveals some differences between values of α, real admittance, and thus noise. The Au, DLC:N and ITO electrodes were all nominally the same area, yet the real admittance, and thus noise, is largest for Au and smallest for ITO. The α factors also support this trend, with ITO having a nearly ideal α value of 0.96. The CF electrodes had a nominal area that was four times smaller than the planar electrodes, and, as expected, the imaginary admittance was ~ 4x smaller. On the other hand, the real admittance of the CF electrodes was comparable to the larger ITO electrode despite the large difference in area. The α parameter determined from a fit to the data confirms that the CF electrodes have a larger thermal noise comparable to that of a Au planar electrode once the area is taken into account. We next examine the current noise standard deviation to confirm these material differences.
The standard deviation of current noise increases with the square root of the area of the working electrode and approximately linearly with the bandwidth of the recording
As demonstrated by the data of Fig. 5, series resistance contributes little to the admittance of electrochemical microelectrodes under our recording conditions. Therefore the thermal current noise PSD is approximately given by:
| (7) |
Integration of the PSD over all frequencies contained in the measurement yields the current variance (σI2). The standard deviation of the current noise (σI) is the square root of the variance. If an ideal low-pass-filter is used to filter the measured signal with cutoff frequency (bandwidth) B, then:
| (8) |
Combining Eq.s 7 and 8 predicts that σI is given by:
| (9) |
and thus σI is proportional to B(α+1)/2. Since α is ~0.9, the current standard deviation is expected to increase approximately linearly with the bandwidth of the measurement. In addition, since the admittance is proportional to the electrode area, σI is expected to be proportional to the square root of the area of the working electrode.
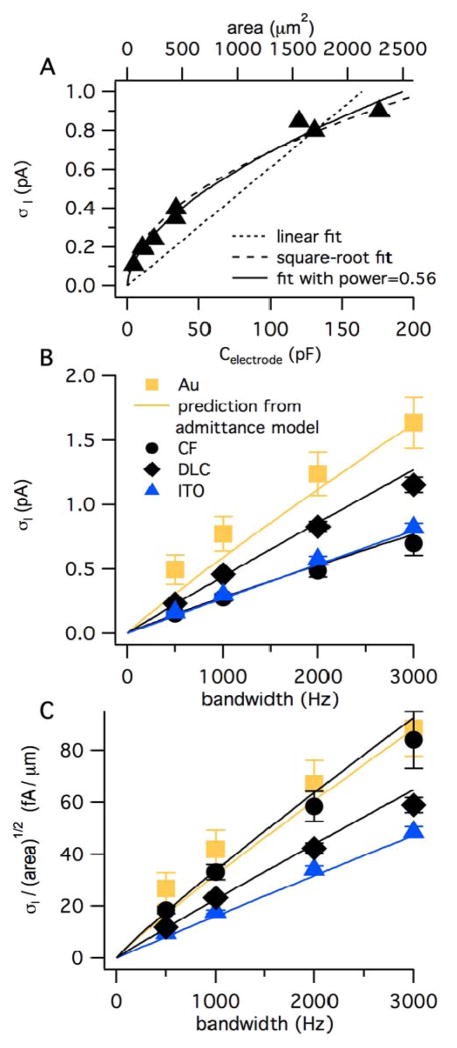
Fig. 6A is a plot of σI versus electrode capacitance for ITO electrodes of various areas. Since electrode capacitance is proportional to area (Fig. S-2), the capacitance can be rescaled to area (top axis). Clearly the data are better fit with a square-root relationship between current noise and area (dashed curve) than a linear relationship (dotted line). When a general power law was used as the fitting function, the best-fit power was 0.56 (solid curve). Similar results were obtained for electrodes fabricated from Au and DLC (data not shown). On the other hand, σI increases linearly with area for much larger electrodes (> ~ 3000 μm2) because capacitive-loading noise dominates (Eq. 2 and Fig. S-3 in Supporting Information).
Fig. 6.
The current noise standard deviation (σI) increases with the square root of electrode area and approximately linearly with the bandwidth of the recording. A. σI is plotted versus electrode capacitance for ITO electrodes where the areas were varied as depicted in Fig. 1. The top axis converts electrode capacitance to area using the slope of 0.077 pF/μm2 obtained from the data of Fig. S-2. The bandwidth was 1 kHz. B. σI recorded at a potential of 600 mV is plotted versus bandwidth for Au, DLC:N and ITO planar electrodes with nominal areas of ~300 μm2 whereas carbon-fiber microelectrodes had nominal areas of ~80 μm2. The bandwidth was set using digital filtering of data originally recorded with a bandwidth of 5 kHz. The curves are the predicted noise from Eq. 9 using values of α and CCPE obtained from fits of the admittance data presented in Fig. 5. The error bars represent SE and are in some cases smaller than the symbol size. C. The current noise normalized to the square root of electrode area is plotted versus bandwidth. The mean area of each type of electrode was estimated by dividing the capacitance measured at 1 kHz by 0.077 pF/μm2.
Fig. 6B plots σI versus bandwidth for the three planar electrode materials and carbon-fiber microelectrodes with each measurement reflecting the mean value from five to seven electrodes. The curves are not fits to the noise data, but rather the predicted noise based on application of Eq. 9 using fits to the admittance data depicted in Fig. 5. The noise data thus clearly support the hypothesis that current noise originates from the thermal noise of the electrodes as described by a constant phase element model.
Fig. 6C is a plot of current noise normalized to the square root of area versus bandwidth to allow direct comparison of noise data between the various materials tested. The data support the prediction from the admittance data, that, for a given electrode area, ITO electrodes give the best noise performance, DLC:N gives an intermediate noise performance, and Au and CF electrodes give the poorest noise performance.
The current noise of electrodes is not greatly affected by adherent cells
In order to measure quantal exocytosis with high temporal resolution, electrodes must be directly adjacent to cells30. Therefore carbon-fiber electrodes are pressed gently to the surface of the cell whereas it is desirable for cells to tightly adhere to planar electrodes so they do not wash away upon solution exchange13–14. Gleixner and Fromherz31 measure the sheet resistance (Rsheet) between adherent cells and a fibronectin-coated silica substrate to be ~10 MΩ in physiological bath solution. If a disk electrode is covered by a hemispherical cell of the same diameter, then the additional series resistance introduced by the thin cell-substrate electrolyte film is Rsheet/8π (derivation not shown). Therefore, we expect a tightly adherent cell to introduce a series resistance of roughly 400 kΩ. The capacitance (measured at 1 kHz) of a cell-sized electrode is ~10 pF, yielding an electrode time constant of ~4 μs. Thus for frequencies in the kHz range, ωαRsCCPE ≪ 1 and therefore Eq. 6 predicts the additional series resistance will not have a large effect on the thermal noise.
Fig. 7 presents a sample recording of quantal exocytosis from a bovine chromaffin cell on a Au electrode with a nominal area of ~300 μm2. The baseline current standard deviation between amperometric spikes is 0.7 pA for a bandwidth of 1 kHz. This value is similar to our previous measurements with bare electrodes (Fig. 6B). In order to determine if the adherent cell increased the noise we carried out four paired recordings before and after adding cells. In each case the presence of a cell immediately adjacent to the electrode was confirmed by recording amperometric spikes with fast rise times in response to a high K+ solution. The presence of the cell increased the current noise by 1.0 ± 3.9%, therefore we conclude that cells immediately adjacent to electrodes do not appreciably increase the background noise for amperometric recordings.
Fig. 7.
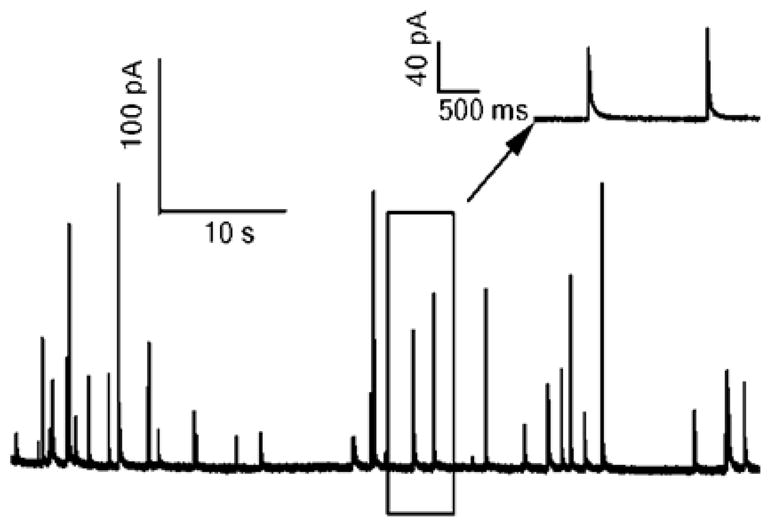
The baseline noise during amperometric measurement of quantal exocytosis from adherent cells is comparable to that of bare microelectrodes. Amperometric spikes resulting from exocytosis were elicited from bovine chromaffin cells using a high K+ solution. Recording was carried out using a Au microelectrode with an area of ~350 μm2. The recording bandwidth is 1 kHz and the potentiostat feedback resistor was 500 MΩ. The standard deviation of the current between spikes is ~0.7 pA. The inset depicts amperometric spikes within the rectangle on an expanded time scale.
Conclusions
Our results demonstrate that the limiting source of current noise originates from the working electrode surface, is thermal in origin and is well described by a constant phase element model. Our experimental measurements also demonstrate that the source of the limiting noise is the same for probe electrodes and microchip electrodes despite major differences in the fabrication processes.
It is important to note that achieving the fundamental thermal noise minimum requires careful electrode fabrication and measurement. The amplifier can also be the dominant noise source under some circumstances (e.g., ref32), which is discussed in the Supplemental Information.
Our results also demonstrate that, despite previous suggestions2, 25, 33, capacitive loading of the amplifier (enC noise) is not the dominant noise source for amperometric measurements using microelectrodes as further discussed in Supplemental Information. Shot noise and thermal noise due to the diffusional or “Warburg” impedance are also not important noise sources under common recording conditions (also further elaborated in Supplemental Information). Our cell measurements also demonstrate that the increase in series resistance resulting from an adherent cell does not lead to a large increase in the baseline noise.
Whereas the amperometric noise is lowest for ITO and highest for Au among the electrode materials we tested, it is possible that there are also differences in the measured amperometric signals originating from exocytosis when different materials are used. Clearly the kinetics of electron transfer are faster on noble-metal electrodes compared to carbon-based electrodes (e.g.,34), but the rate of release of transmitter from the vesicle matrix and diffusion to the electrode surface are much more likely to be the rate-limiting steps for measurement of quantal exocytosis using amperometry35. Nevertheless, differences in spike areas have been noted between electrodes fabricated from ITO compared to other materials22, 36. Therefore further study is needed to determine which electrode materials offer the best signal-to-noise ratio.
Surface-patterned electrodes provide the opportunity to carefully control electrode geometries and select from a range of materials, and our data suggest that DLC:N and ITO electrodes are a good choice for low noise. These two materials also offer optical transparency to easily image cells over the electrodes9–10, 21 and DLC:N has the further advantage that it promotes cell adhesion to electrodes13–14.
Supplementary Material
Acknowledgments
This research work is supported by NIH R01NS048826 and R01MH095046. We thank Jennings meat shop, New Franklin, MO, for their generous donation of bovine adrenal glands.
Footnotes
Electronic Supplementary Information (ESI) available: [Details concerning the processes used for electrode fabrication and testing are presented in the Supporting Experimental Section. The Supporting Results Section presents experiments that demonstrate electrode responses with a test analyte and a plot of electrode capacitance versus area. Results are presented demonstrating that the noise standard deviation increases with the square-root of electrode area for small electrodes, but increases linearly with area for larger electrodes. The Supporting Discussion Section provides elaboration on possible noise sources for amperometric measurements using microelectrodes and summarizes strategies for reducing noise during amperometric recording of exocytosis.]. See DOI: 10.1039/b000000x/
Contributor Information
Jia Yao, Email: jy4dc@mail.missouri.edu.
Kevin D. Gillis, Email: gillisk@missouri.edu.
References
- 1.Wightman RM, Jankowski JA, Kennedy RT, Kawagoe KT, Schroeder TJ, Leszczyszyn DJ, Near JA, Diliberto EJ, Jr, Viveros OH. Proceedings of the National Academy of Sciences of the United States of America. 1991;88:10754–10758. doi: 10.1073/pnas.88.23.10754. [DOI] [PMC free article] [PubMed] [Google Scholar]
- 2.Hochstetler SE, Puopolo M, Gustincich S, Raviola E, Wightman RM. Analytical Chemistry. 2000;72:489–496. doi: 10.1021/ac991119x. [DOI] [PubMed] [Google Scholar]
- 3.Borges R, Camacho M, Gillis KD. Acta Physiologica. 2008;192:173–184. doi: 10.1111/j.1748-1716.2007.01814.x. [DOI] [PubMed] [Google Scholar]
- 4.Chow RH, Von Ruden L, Neher E. Nature. 1992;356:60–63. doi: 10.1038/356060a0. [DOI] [PubMed] [Google Scholar]
- 5.De Toledo GA, Fernandez-Chacon R, Fernandez JM. Nature. 1993;363:554–558. doi: 10.1038/363554a0. [DOI] [PubMed] [Google Scholar]
- 6.Mosharov EV, Sulzer D. Nature Methods. 2005;2:651–658. doi: 10.1038/nmeth782. [DOI] [PubMed] [Google Scholar]
- 7.Wang CT, Bai J, Chang PY, Chapman ER, Jackson MB. Journal of Physiology. 2006;570:295–307. doi: 10.1113/jphysiol.2005.097378. [DOI] [PMC free article] [PubMed] [Google Scholar]
- 8.Chen P, Xu B, Tokranova N, Feng X, Castracane J, Gillis KD. Analytical Chemistry. 2003;75:518–524. doi: 10.1021/ac025802m. [DOI] [PubMed] [Google Scholar]
- 9.Chen X, Gao Y, Hossain M, Gangopadhyay S, Gillis KD. Lab on a Chip - Miniaturisation for Chemistry and Biology. 2007;8:161–169. doi: 10.1039/b715308m. [DOI] [PMC free article] [PubMed] [Google Scholar]
- 10.Sun X, Gillis KD. Analytical Chemistry. 2006;78:2521–2525. doi: 10.1021/ac052037d. [DOI] [PubMed] [Google Scholar]
- 11.Gao Y, Bhattacharya S, Chen X, Barizuddin S, Gangopadhyay S, Gillis KD. Lab on a Chip - Miniaturisation for Chemistry and Biology. 2009;9:3442–3446. doi: 10.1039/b913216c. [DOI] [PubMed] [Google Scholar]
- 12.Gao Y, Chen X, Gupta S, Gillis KD, Gangopadhyay S. Biomedical Microdevices. 2008;10:623–629. doi: 10.1007/s10544-008-9173-8. [DOI] [PMC free article] [PubMed] [Google Scholar]
- 13.Sen A, Barizuddin S, Hossain M, Polo-Parada L, Gillis KD, Gangopadhyay S. Biomaterials. 2009;30:1604–1612. doi: 10.1016/j.biomaterials.2008.11.039. [DOI] [PMC free article] [PubMed] [Google Scholar]
- 14.Barizuddin S, Liu X, Mathai JC, Hossain M, Gillis KD, Gangopadhyay S. ACS Chemical Neuroscience. 2010;1:590–597. doi: 10.1021/cn1000183. [DOI] [PMC free article] [PubMed] [Google Scholar]
- 15.Hafez I, Kisler K, Berberian K, Dernick G, Valero V, Yong MG, Craighead HG, Lindau M. Proceedings of the National Academy of Sciences of the United States of America. 2005;102:13879–13884. doi: 10.1073/pnas.0504098102. [DOI] [PMC free article] [PubMed] [Google Scholar]
- 16.Dias AF, Dernick G, Valero V, Yong MG, James CD, Craighead HG, Lindau M. Nanotechnology. 2002;13:285–289. [Google Scholar]
- 17.Berberian K, Kisler K, Qinghua F, Lindau M. Analytical Chemistry. 2009;81:8734–8740. doi: 10.1021/ac900674g. [DOI] [PMC free article] [PubMed] [Google Scholar]
- 18.Spégel C, Heiskanen A, Acklid J, Wolff A, Taboryski R, Emnéus J, Ruzgas T. Electroanalysis. 2007;19:263–271. [Google Scholar]
- 19.Spégel C, Heiskanen A, Pedersen S, Emnéus J, Ruzgas T, Taboryski R. Lab on a Chip - Miniaturisation for Chemistry and Biology. 2008;8:323–329. doi: 10.1039/b715107a. [DOI] [PubMed] [Google Scholar]
- 20.Dittami GM, Rabbitt RD. Lab on a Chip - Miniaturisation for Chemistry and Biology. 2010;10:30–35. doi: 10.1039/b911763f. [DOI] [PMC free article] [PubMed] [Google Scholar]
- 21.Amatore C, Arbault S, Chen Y, Crozatier C, Lemaître F, Verchier Y. Angewandte Chemie - International Edition. 2006;45:4000–4003. doi: 10.1002/anie.200600510. [DOI] [PubMed] [Google Scholar]
- 22.Amatore C, Arbault S, Lemaître F, Verchier Y. Biophysical Chemistry. 2007;127:165–171. doi: 10.1016/j.bpc.2007.01.007. [DOI] [PubMed] [Google Scholar]
- 23.Schulte A, Chow RH. Analytical Chemistry. 1996;68:3054–3058. doi: 10.1021/ac960210n. [DOI] [PubMed] [Google Scholar]
- 24.Sigworth FJ. In: Single-channel recording. 2. Sakmann B, Neher E, editors. Plenum Press; New York: 1995. [Google Scholar]
- 25.Long JT, Weber SG. Analytical Chemistry. 1988;60:2309–2311. doi: 10.1021/ac00166a002. [DOI] [PubMed] [Google Scholar]
- 26.Gillis KD. Pflugers Arch. 2000;439:655–664. doi: 10.1007/s004249900173. [DOI] [PubMed] [Google Scholar]
- 27.Pajkossy T. Solid State Ionics. 2005;176:1997–2003. [Google Scholar]
- 28.Cole KS, Cole RH. J Chem Phys. 1941;9:341–351. [Google Scholar]
- 29.Cole KS, Cole RH. J Chem Phys. 1942;10:98–105. [Google Scholar]
- 30.Jankowski JA, Schroeder TJ, Ciolkowski EL, Wightman RM. Journal of Biological Chemistry. 1993;268:14694–14700. [PubMed] [Google Scholar]
- 31.Gleixner R, Fromherz P. Biophysical Journal. 2006;90:2600–2611. doi: 10.1529/biophysj.105.072587. [DOI] [PMC free article] [PubMed] [Google Scholar]
- 32.Schulte A, Chow RH. Analytical Chemistry. 1998;70:985–990. doi: 10.1021/ac970934e. [DOI] [PubMed] [Google Scholar]
- 33.Neher E, Chow RH. Bioelectrochemistry and Bioenergetics. 1995;38:251–253. [Google Scholar]
- 34.Zachek MK, Hermans A, Wightman RM, McCarty GS. Journal of Electroanalytical Chemistry. 2008;614:113–120. doi: 10.1016/j.jelechem.2007.11.007. [DOI] [PMC free article] [PubMed] [Google Scholar]
- 35.Schroeder TJ, Borges R, Finnegan JM, Pihel K, Amatore C, Wightman RM. Biophys J. 1996;70:1061–1068. doi: 10.1016/S0006-3495(96)79652-2. [DOI] [PMC free article] [PubMed] [Google Scholar]
- 36.Kisler K, Kim B, Berberian K, Fang Q, Lindau M. Biophys J. 2007;92:83a. [Google Scholar]
Associated Data
This section collects any data citations, data availability statements, or supplementary materials included in this article.


