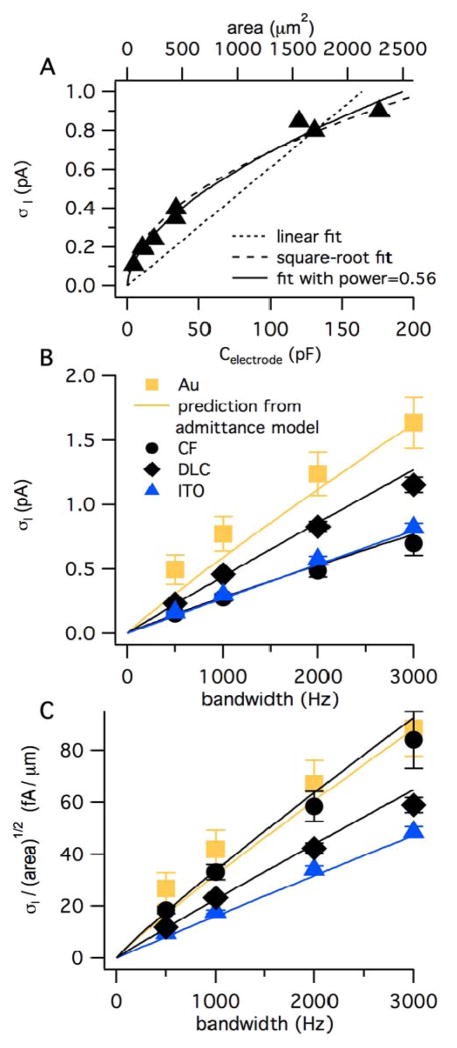
Fig. 6.
The current noise standard deviation (σI) increases with the square root of electrode area and approximately linearly with the bandwidth of the recording. A. σI is plotted versus electrode capacitance for ITO electrodes where the areas were varied as depicted in Fig. 1. The top axis converts electrode capacitance to area using the slope of 0.077 pF/μm2 obtained from the data of Fig. S-2. The bandwidth was 1 kHz. B. σI recorded at a potential of 600 mV is plotted versus bandwidth for Au, DLC:N and ITO planar electrodes with nominal areas of ~300 μm2 whereas carbon-fiber microelectrodes had nominal areas of ~80 μm2. The bandwidth was set using digital filtering of data originally recorded with a bandwidth of 5 kHz. The curves are the predicted noise from Eq. 9 using values of α and CCPE obtained from fits of the admittance data presented in Fig. 5. The error bars represent SE and are in some cases smaller than the symbol size. C. The current noise normalized to the square root of electrode area is plotted versus bandwidth. The mean area of each type of electrode was estimated by dividing the capacitance measured at 1 kHz by 0.077 pF/μm2.

