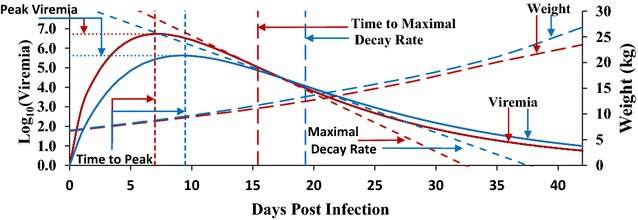
Fig. 1.

Comparison of response to infection when pigs are infected with NVSL (red) or KS06 (blue) PRRSV isolates. For comparison between viruses, trials were matched based on genetic background. Least square means of daily viremia, predicted using the monophasic Wood’s curve parameters, and weights were estimated using ASReml [28] with the full G-matrix. Viremia, Weight, Time to Peak, Peak Viremia, Time to Maximal Decay, and Maximal Decay were compared when pigs were infected with either the NVSL or KS06 PRRSV isolate
