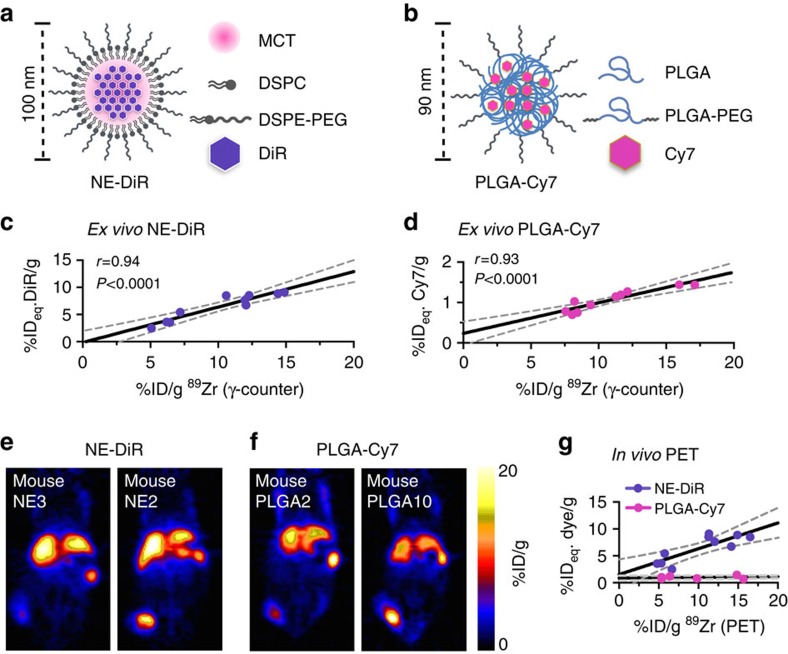
Figure 3. Nanoreporter PET quantifies nanoemulsion and PLGA nanoparticle uptake.
Structure and composition of (a) NE-DiR and (b) PLGA-Cy7. Correlation between (c) 89Zr-NRep (%ID per g) and DiR (%IDeq./g) uptake (N=10), and (d) 89Zr-NRep (%ID per g) and Cy7 (%IDeq./g) uptake (N=10), at 24 h post co-administration of NE-DiR and 89Zr-NRep and PLGA-Cy7 and 89Zr-NRep, respectively. (e) Representative PET images of 4T1 tumour-bearing mice at 24 h post co-injection of NE-DiR and 89Zr-NRep showing low (mouse NE3, left) and high (mouse NE2, right) 89Zr uptake. (f) Representative PET images of 4T1 tumour-bearing mice at 24 h post co-injection of PLGA-Cy7 and 89Zr-NRep showing low (mouse PLGA2, left) and high (mouse PLGA10, right) 89Zr uptake. (g) Correlation between 89Zr uptake values generated by non-invasive PET imaging and DiR (purple (N=10), r=0.83, P<0.01) and Cy7 (pink (N=10), r=0.33, P=0.38) concentrations in tumours from mice co-injected with NE-DiR and 89Zr-NRep, and PLGA-Cy7 and 89Zr-NRep, respectively. Pearson's r coefficients were calculated to determine correlation.

