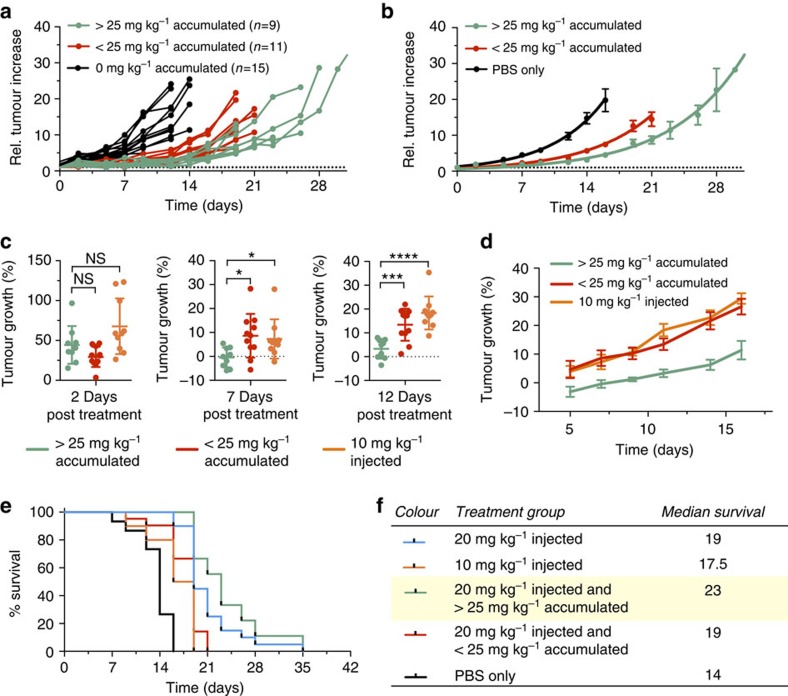
Figure 5. Predictive value of 89Zr-NRep PET imaging.
(a) Individual tumour size increase in mouse cohorts treated with 20 mg kg−1 Doxil and >25 mg kg−1 intratumoural DOX concentration (N=9, green);<25 mg kg−1 intratumoural Doxil concentration (N=11, red) and controls (N=15, black). (b) Mean values of the groups in a. (c) Compared tumour growth rates for mice treated with 20 mg kg−1 Doxil that received >25 mg kg−1 intratumoural DOX (green, N=9), <25 mg kg−1 DOX (red, N=11) or 10 mg kg−1 Doxil (orange, N=10) at 2 days (left), 7 days (middle) and 12 days (right) post-treatment. The data from 2 days represent the initial daily growth rate (days 0–2, left); the 7- and 12-day data are the average daily growth rates from day 2 onwards. (d) Mean values of the average daily growth rates from day 2 onwards. (e,f) Kaplan–Meier plot and table showing the survival and median survival of individual mouse cohorts treated with 20 mg kg−1 Doxil (blue, N=20), 10 mg kg−1 Doxil (orange, N=10), 20 mg kg−1 Doxil and >25 mg intratumoural DOX per kg (green, N=9) or <25 mg intratumoural DOX per kg (red, N=11), plus the PBS treated control group (black, N=15). Error bars are s.e.m. P values were calculated with one-way analysis of variance (ANOVA) followed by Tukey's HSD; NS, not significant, *P<0.05, **P<0.01, ****P<0.0001.

