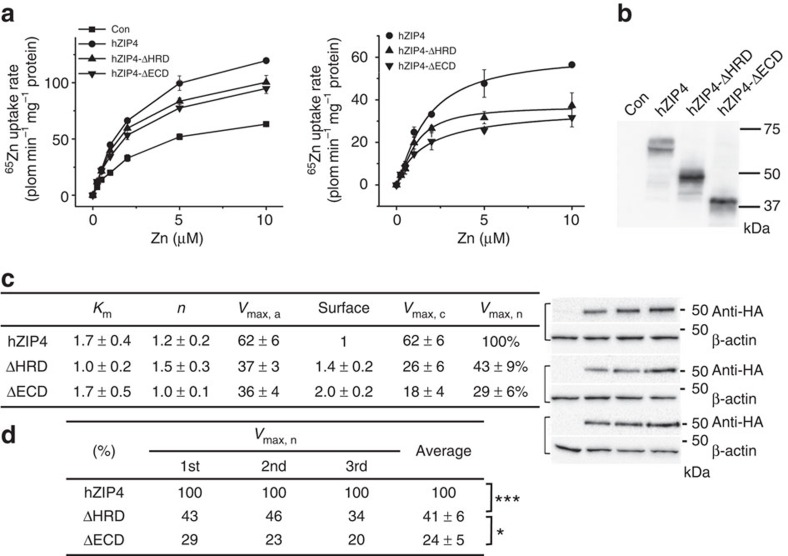
Figure 4. The role of the HRD in zinc transport.
(a) Zinc uptake assay and curve fitting of hZIP4, hZIP4-ΔHRD and hZIP4-ΔECD expressed in HEK293T cells. left: the raw experimental data; right: the processed data. Each data point represents the mean of three replicates. The error bars indicate 1±s.d. The results of curve fitting using the Hill model are shown in the Table 1 (c). (b) Western blot of hZIP4, hZIP4-ΔHRD and hZIP4-ΔECD expressed in HEK293T cells and surface expression levels are indicated by the surface bound anti-HA antibody with three replicates. β-actin was detected using anti-β-actin antibody in western blot as loading control. (c) Zinc transport kinetic parameters. The shown data are results of one out of three independent experiments. The data from the other two experiments are shown in Supplementary Fig. 8c,d. The units of Km and Vmax are μM and pmol min−1 mg−1, respectively. (d) Statistical analysis of the normalized Vmaxs (Vmax, n) from three independent experiments. The Student's t-test was used to assess significance statistically. ***P<0.001 and *P<0.05.

