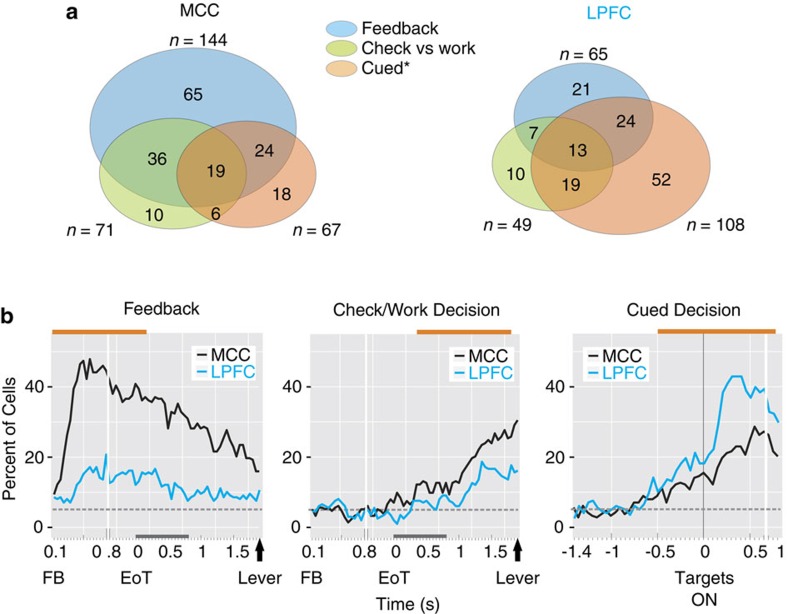
Figure 4. Proportions of neurons encoding feedback and decisions.
(a) Venn representations of the overall number of neurons discriminating significantly negative/positive feedback, Check versus Work decisions and/or Cued decisions in the main task during the time epochs indicated in orange on top of graphs in b. Stars indicate significant differences between MCC and LPFC. (b) Time resolved proportion of cells extracted from the sliding glm (see ‘Sliding generalized linear models' in Methods) with a significant discrimination of feedback, Check versus Work and Cued decisions. Data presented during the time period between feedback (FB) and lever onset, and aligned on the end of trial signal (EoT, grey bars on the x axis represent the duration of the EoT) for Feedback and Check versus Work and on target onset for Cued decisions. Dashed grey lines represent the 5% level.

