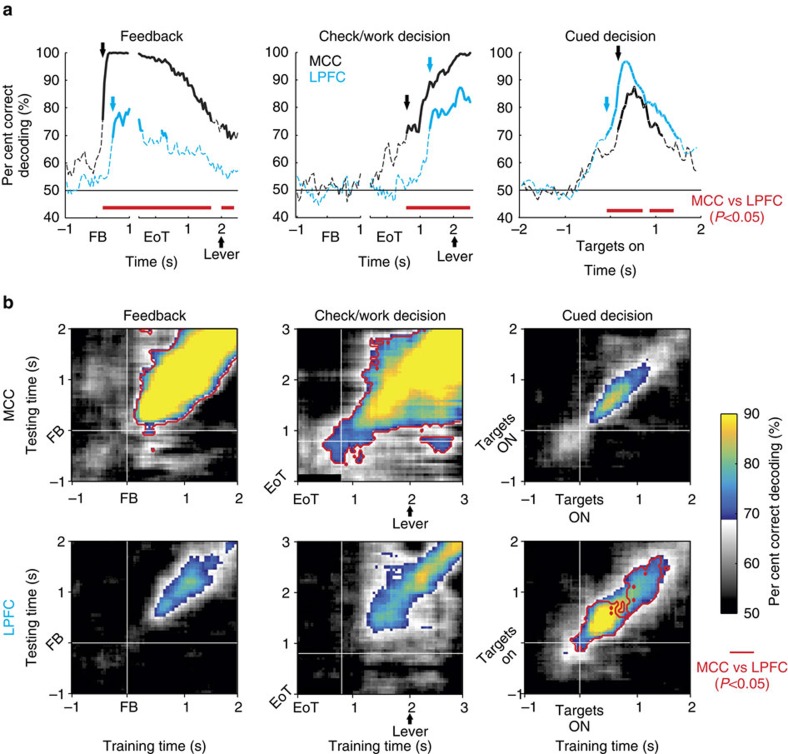
Figure 5. Linear population coding.
Linear decoding (a) and cross-temporal decoding (b) reveal a double dissociation between MCC contributing earlier and more reliably to Feedback processing and Check versus Work decisions, and LPFC contributing earlier and more reliably to Cued decisions during the main task. Arrows in a indicate first significant decoding (bold) for each area (colour). Statistical threshold was set at P<0.05 using permutation testing. Significant decoding is depicted by bold lines in a. Cross-temporal decoding in b were thresholded (grey colourmap) depending on the smallest significant decoding rate at P<0.05. Statistical comparisons of MCC and LPFC population coding were tested using KW tests. Significant differences (at P<0.05, Bonferroni corrected) are displayed in red on the time axis in a and within a red contour in b. The red line is drawn at the level of the structure with better decoding performance.

