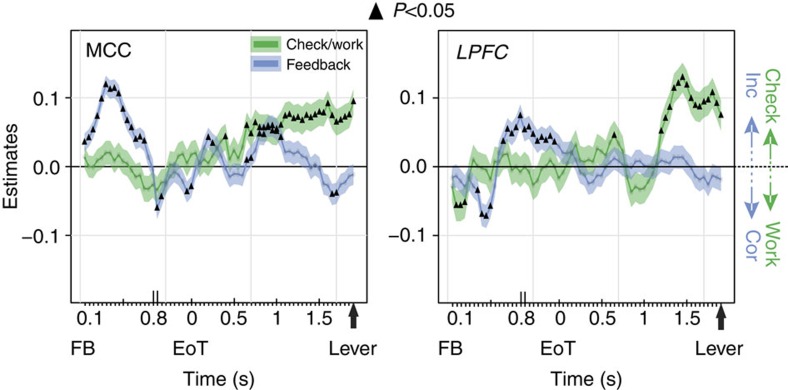
Figure 7. Feedback and Check versus Work specificities at the cell group level.
Estimates (β-coefficients) obtained from the MCC and LPFC population, and time-resolved glm for Check versus Work (green) and Feedback (blue) variables (see ‘Group analyses using glmm' in Methods). Significant effects are indicated by a black triangle (P<0.05). Positive values depict a population activity bias towards Check decisions (green line) or negative feedback (blue line), whereas the opposite represent a bias towards Work decisions or Positive feedback.

