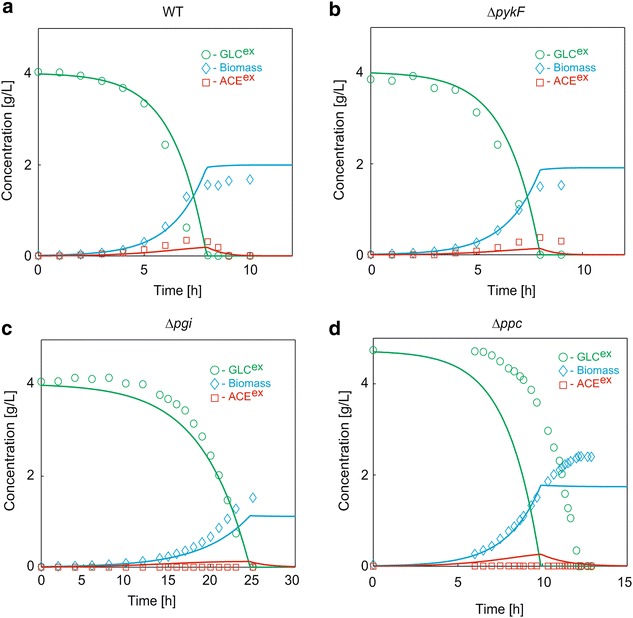
Fig. 2.

The experimental validation of WT and genetic mutant strains in a batch culture. The green, blue and red lines represent the simulation results of the extracellular glucose, biomass and acetate, respectively. The corresponding open circles represent the experimental data. a WT. b ∆pykF. c ∆pgi. d ∆ppc
