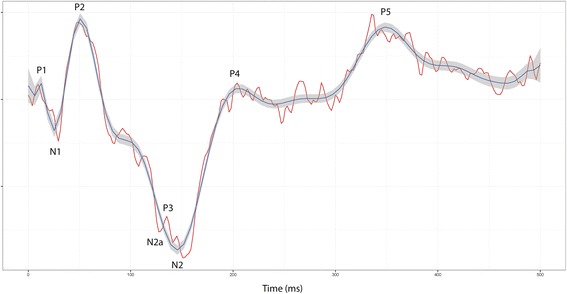
Fig. 5.

Equine FVEP waveform. An equine FVEP waveform with typical peaks and troughs indicated (from horse B; position Pz-30). The red curve shows one recording (144 averaged responses). Data from 40 recordings (with 144 responses each) are averaged into the blue curve and shown with a 95 % confidence interval. Vertical division = 5 μV
