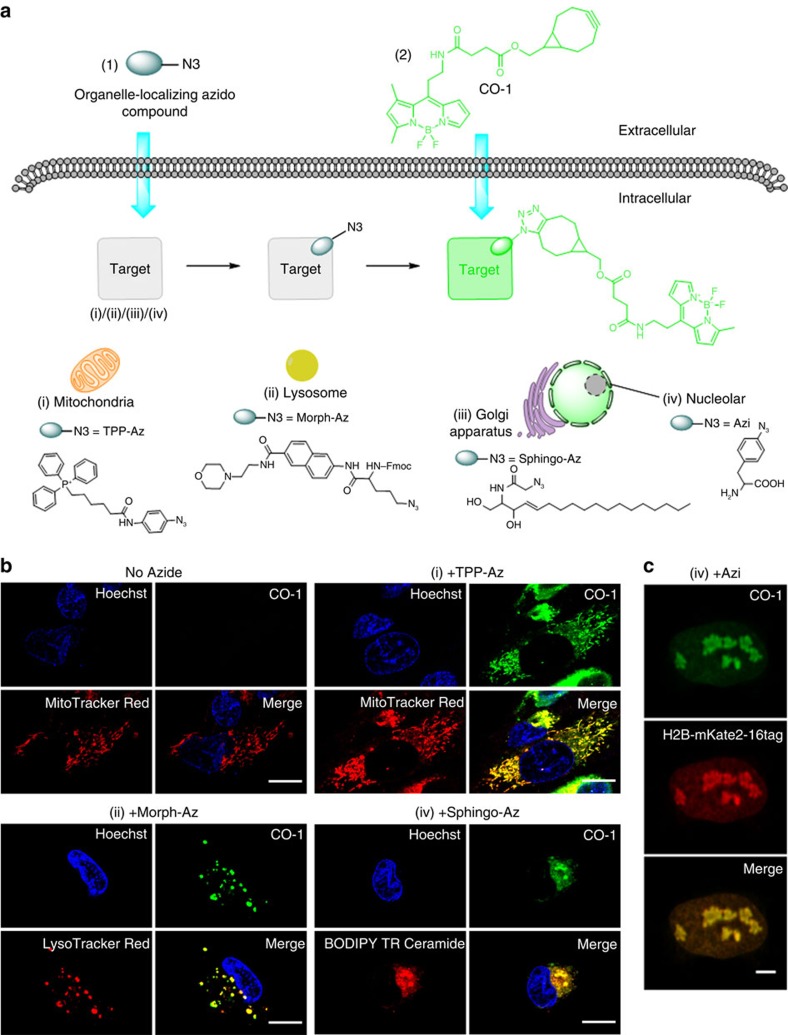
Figure 3. Live cell imaging with CO-1.
(a) Chemical structures and schematic illustration of the covalent labelling of azide-tagged organelles using CO-1 in live cells. (b) Fluorescence imaging of mitochondria, lysosome and golgi apparatus in U-2 OS cells labelled with CO-1. Cells pre-treated with TPP-Az, Morph-Az or Sphingo-Az were incubated with 2 μM CO-1 in growth media at 37 °C for 1 h and followed by counterstaining with organelle trackers. Scale bar, 15 μm. (c) Fluorescence imaging of histone H2B in live U-2 OS. U-2 OS cells were co-transfected with plasmids pIre-Azi3 and pmH2B-6-mKate2-16tag to incorporate UAA Azi into H2B-mKate2 at site 16. After Azi incorporation, cells were labelled with 10 μM CO-1 for 90 min at 37 °C. Cells were then washed and imaged. The mKate2 (red) signals were detected in cell nuclei only, and colocalized with the CO-1 (green) signals in the merged image. Scale bar, 5 μm.

