
Fig. 7.
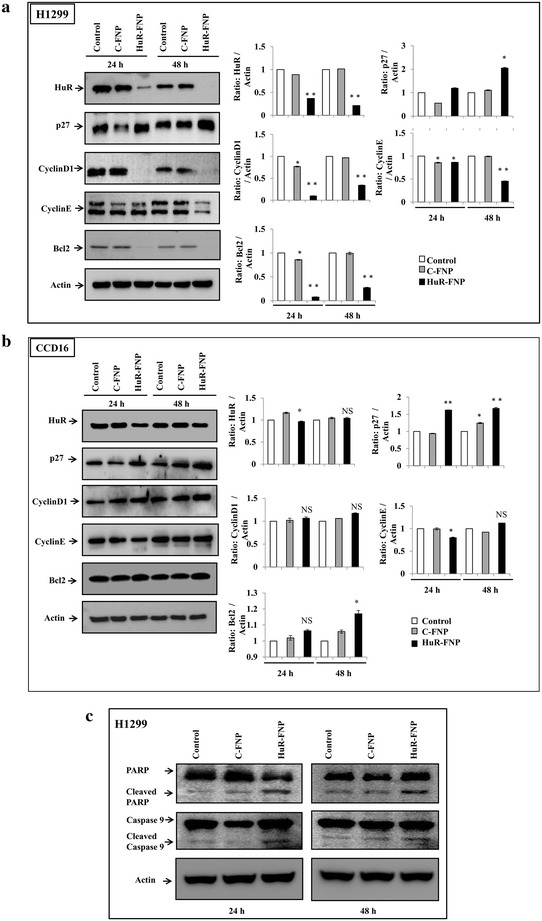
Expression of HuR, and HuR-regulated proteins in cells treated with C-FNP or HuR-FNP. Untreated cells served a control. a H1299, and b CCD16. Bar graphs represent semi-quantitative analysis of the protein expression detected by western blotting. Beta-actin was used as internal loading control. c HuR-FNP-treated H1299 cells underwent apoptosis as indicated by cleavage of caspase-9 and PARP at both 24 and 48 h after treatment compared to C-FNP-treated and untreated control cells. (*p < 0.05; **p < 0.01; NS not significant)