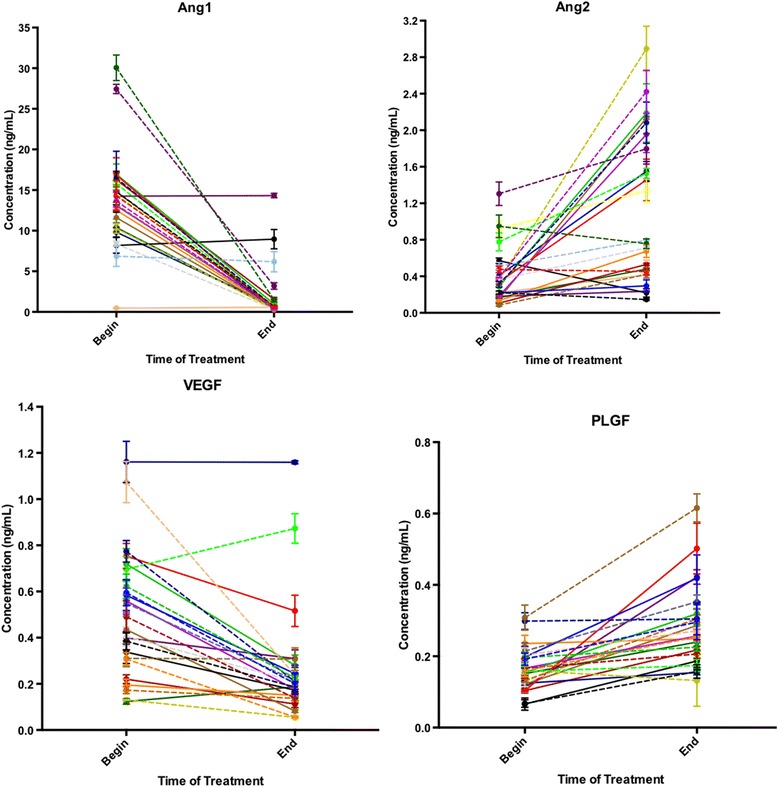
Fig. 2.

Trends in serum angiogenic cytokine concentrations comparing the beginning and end of treatment, as evaluated by non-parametric Wilcoxon signed rank tests. Each line represents an individual patient. Serum levels of Ang1 (p < 0.0001) and VEGF decreased (p < 0.0001) over the course of treament. In contrast, there were significant increases inserum levels of Ang2 (p < 0.0001) and PLGF (p < 0.0001)
