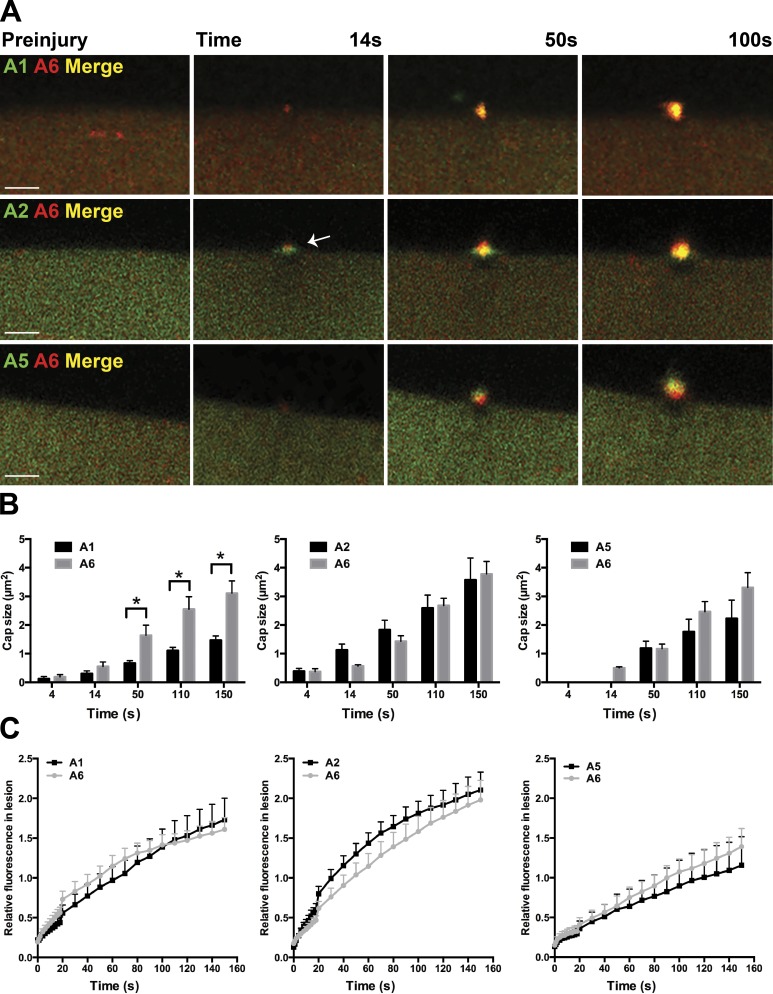
Figure 5.
Relative timing of annexin subunit translocation to the repair cap. Myofibers were coelectroporated with plasmids expressing annexin A6 and A1, A6 and A2, or A6 and A5 to compare the relative kinetics of annexin translocation to the site of sarcolemmal injury. (A) Representative images of electroporated myofibers illustrating each combination of annexin proteins localized to the repair cap. Annexin A2 localized to a broader structure at the base of the cap (white arrow) above the clearance zone just after damage and then formed a tighter repair cap that colocalized with annexin A6, and this was observed by 100s seconds after injury. Bars, 4 µm. (B) Annexin A1 cap size was reduced compared with annexin A6 cap size (*, P < 0.05 at 50 s), whereas there was no significant difference in annexin A2, A5, and A6 cap size (n ≥ 7 myofibers from n = 3 mice per condition). (C) All pairwise comparisons resulted in similar annexin kinetics compared with annexin A6 (n ≥ 7 myofibers from n = 3 mice per condition). Error bars represent SEM.

