Figure 1.
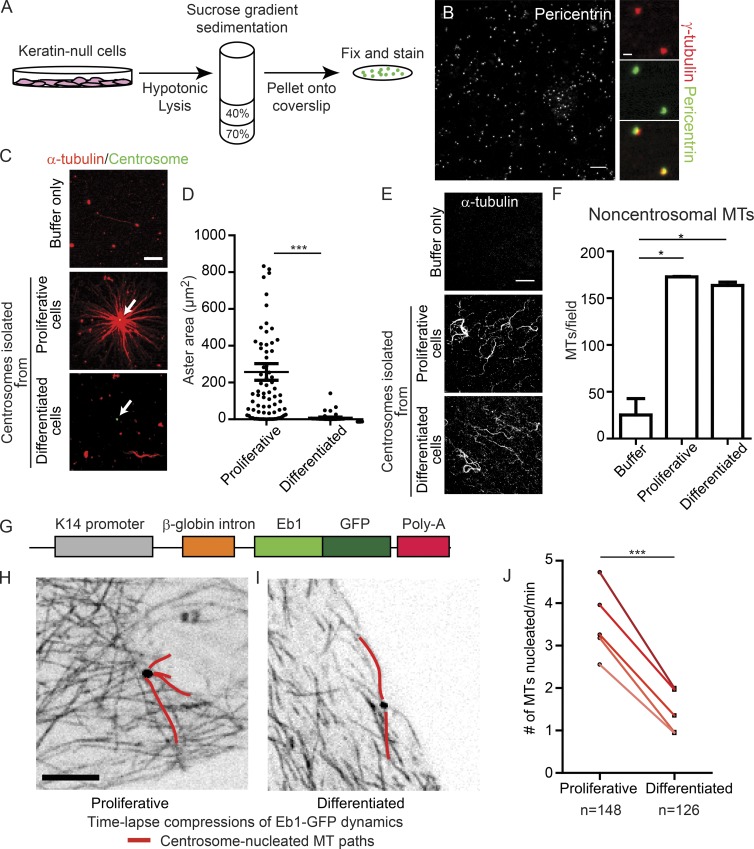
Differentiated centrosomes lose MT-anchoring activity and have decreased nucleation activity. (A) Schematic of centrosome isolation from cultured keratin-null cells. (B) Field of isolated centrosomes stained for pericentrin. Bar, 10 µm. Images on the right show colocalization of γ-tubulin and pericentrin in isolated centrosomal puncta. Bar, 1 µm. (C) Representative images of MT assembly assays in the presence of buffer only, centrosomes from proliferative cells, and centrosomes from differentiated cells. Bar, 10 µm. White arrows indicate centrosomes. (D) Quantification of aster area surrounding purified centrosomes from proliferative and differentiated cells (n ≥ 54 centrosomes from three independent experiments). (E) Representative images of fields of free (noncentrosomal) MTs nucleated in reactions as in C. Bar, 10 µm. (F) Quantification of free (noncentrosomal) MTs in reactions as in C (n ≥ 9 fields from two independent experiments). (G) Diagram of construct used to generate Eb1-GFP expressing mice. (H and I) Compressions of Eb1-GFP movies in proliferative (H) or differentiation (I) keratinocytes derived from the Eb1-GFP transgenic mouse. Bar, 10 µm. (J) Quantification of centrosomal nucleation rate in proliferative and differentiated primary keratinocytes. Five separate replicates of paired samples derived from five independent mice are shown (n ≥ 126 centrosomes). A paired design was used because proliferative and differentiated centrosomes can be measured within the same dish. n.s., not significant; *, P < 0.05; **, P < 0.01; ***, P < 0.001. Data are presented as mean ± SEM.

