
Fig. 2.
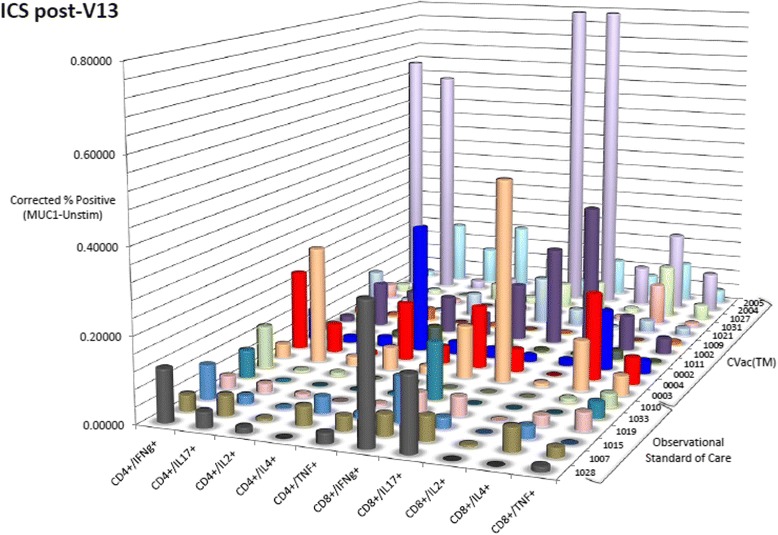
Intracellular cytokine staining (ICS) of CVac-treated patients. Values are corrected for the background (endogenous unstimulated response) subtracted from the mucin 1 (MUC1) challenge shown as a percentage. Values of zero or less are shown as zero. The samples shown represent those patients that had both a baseline sample and a visit 13 sample (completion of 10 doses of CVac treatment) available for analysis