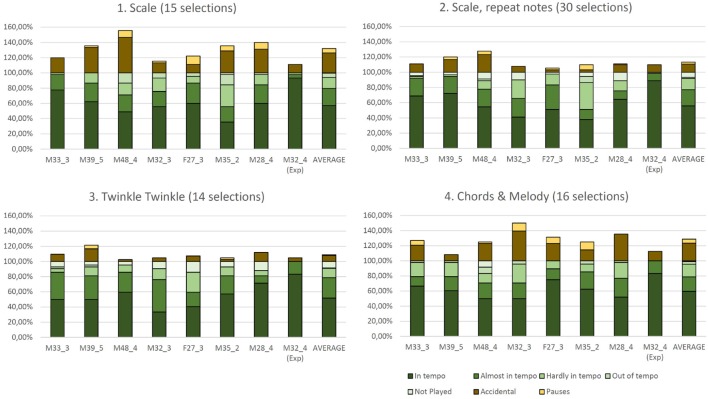
Figure 10.
Quantitative evaluation results of the Melody Layer for eight users for all four tasks. The last column of the plot of each task shows the average performance across all seven users with no previous experience with the EyeHarp. Subject M28_4 is the only user with previous experience with the interface. The different shades of green correspond to the percentages related to the temporal accuracy of each task. The percentages are computed over the total number of selections required for each task. The darkest green corresponds to the percentage of notes played in tempo (accurate to within 1/16), followed by notes played almost in tempo (accurate to within 1/8), hardly in tempo (accurate to within 1/4), out of tempo and not played at all (omitted). All these values sum 100%. In dark brown appears the percentage of wrong or accidentally played notes and in bright brown appears the number of pauses in the task. Pauses refer to the number of times the users stopped during a task and waited till next bar in order to enter in tempo.

