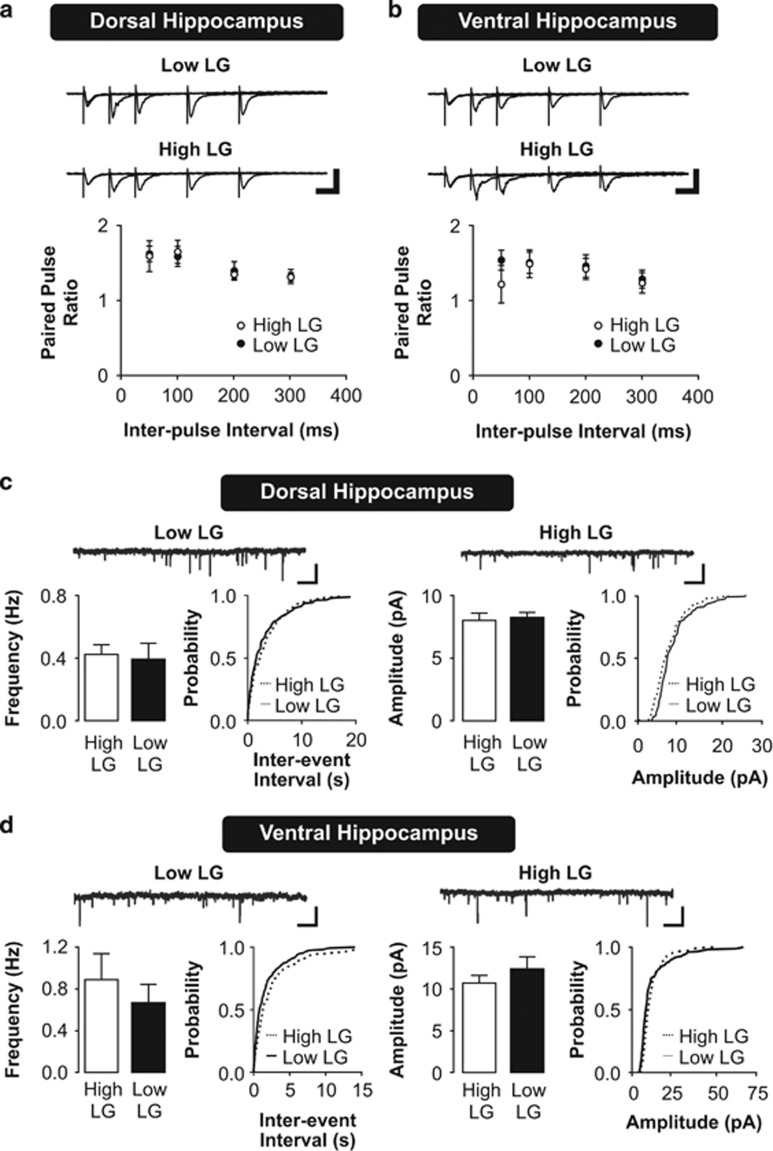
Figure 2.
Presynaptic function and synaptic input in dorsal and ventral hippocampal neurons of high and low LG offspring. (a,b) Paired-pulse facilitation (PPF) of excitatory synaptic responses in the dorsal (a) and ventral (b) hippocampus. Top: representative traces of facilitation of evoked fEPSPs in response to paired pulses delivered at a range of inter-stimulus intervals, average of five traces shown for each inter-stimulus interval. Scale bars represent 0.5 mV (vertical) and 40 ms (horizontal). Bottom: paired-pulse ratios are plotted as mean±SEM of fEPSP2/fEPSP1 (n=7–8 slices from 4 rats per group). (c, d) Miniature excitatory postsynaptic currents (mEPSCs) recorded from CA1 pyramidal neurons in the dorsal (c) or ventral (d) hippocampus. Top: representative traces of mEPSC recordings. Scale bars represent 15 pA (vertical) and 5 s (horizontal). Bottom: histograms depicting mean±SEM frequency and amplitude of mEPSCs (left) and their corresponding cumulative probability plots (right; n=6–8 slices from 3–5 rats per group).

