Figure 1.
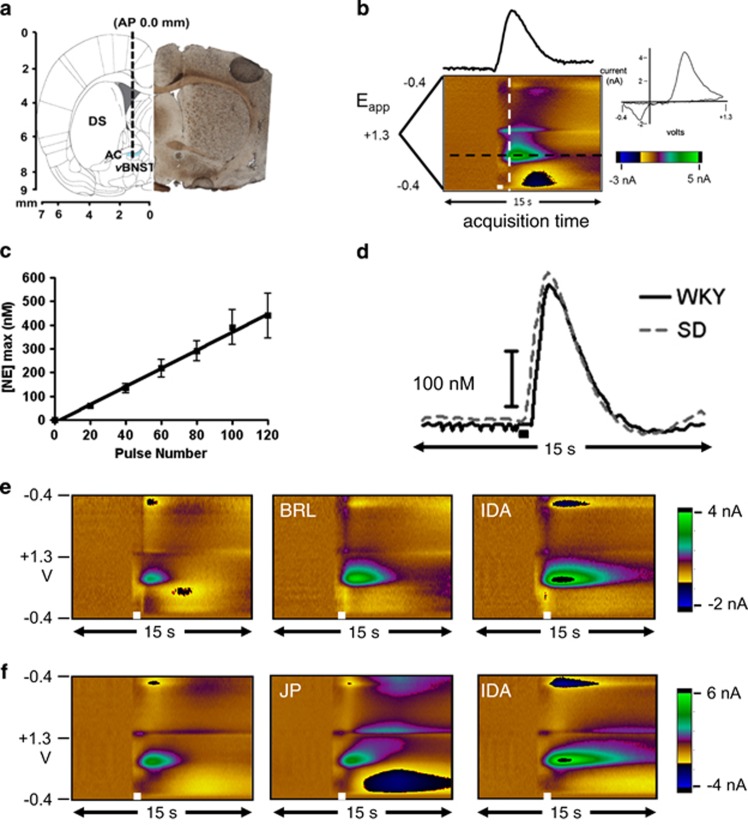
Fast-Scan Cyclic Voltammetry of norepinephrine in the ventral bed nucleus of the stria terminalis (vBNST). (a) Electrode tract (dashed line) and representative histology of carbon-fiber electrode placement in the vBNST (dashed circle; DS, dorsal striatum; AC, anterior commissure). (b) Norepinephrine measured in the vBNST after electrical stimulation (white bar). The cyclic voltammogram (current vs potential) is obtained from the white dashed line, and the concentration vs time trace from the black dashed line. (c) Input-output curve of [NE]max at 20, 40, 60, 80, and 120 stimulation pulses in WKY rats. (d) Representative concentration traces comparing norepinephrine release and uptake in SD and WKY rats. (e and f) Representative color plots of electrically evoked norepinephrine in the vBNST with α2A (BRL), α2C (JP), and non-selective α2 (IDA) antagonists on board in WKY rats.

