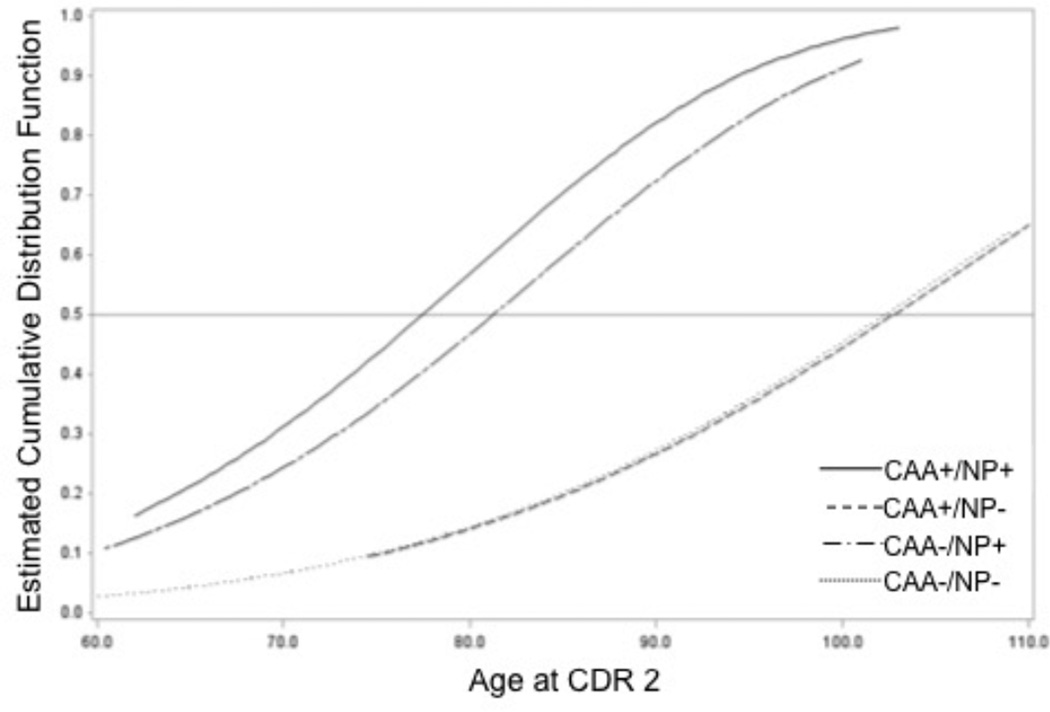
Figure 2.
This plot shows the cumulative probability of moderate-stage dementia classification against age for each of our neuropathologic classifications: no significant neuritic plaque (NP) or cerebral amyloid angiopathy (CAA) burden (CAA−/NP−, black line), no significant CAA burden but significant NP burden (CAA−/NP+, blue line), significant CAA burden with no NP burden (CAA+/NP−, green line), significant CAA and NP burden (CAA+/NP+, red line). The light gray horizontal line at denotes at least 50% of individuals experiencing moderate-stage dementia. Note again how the CAA+/NP+ and CAA−/NP+ groups have high likelihood for experiencing earlier classification as moderately demented.

