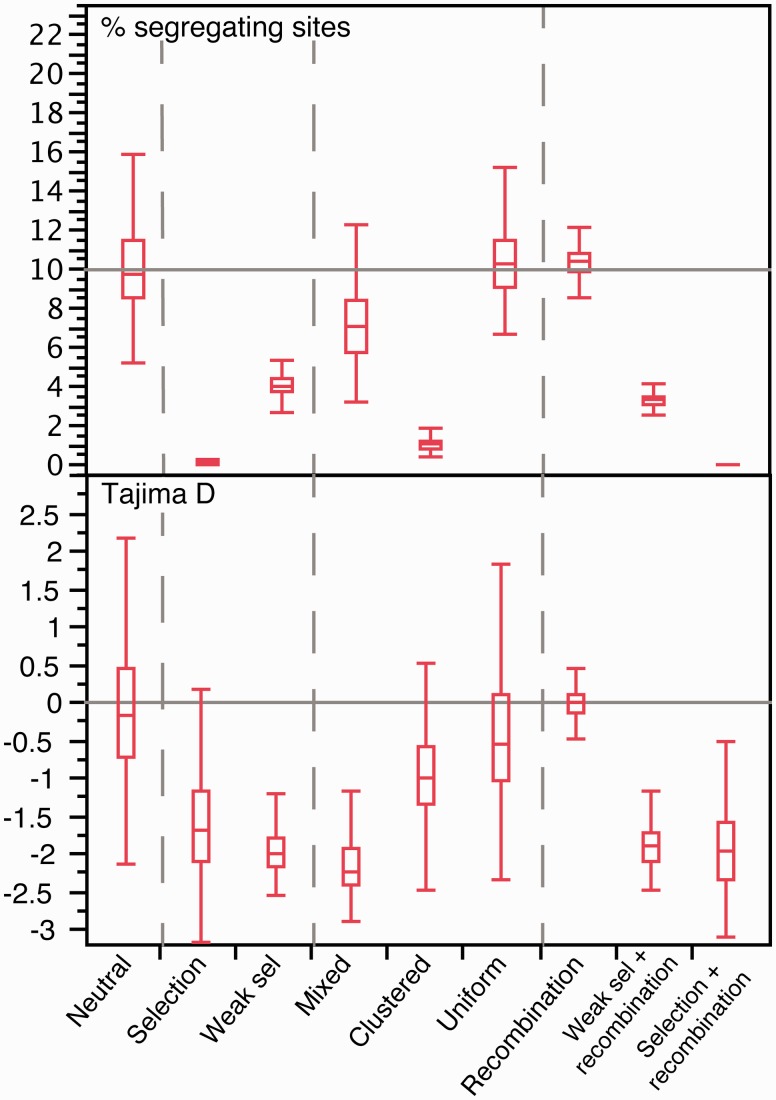
Fig. 2.
Distribution of the number of segregating sites and Tajima D values in each set of 1,000 simulations. The gray line in the top panel corresponds to the expected number of segregating sites under the standard neutral model: where . Here, , , and . The gray line in the bottom panel corresponds to the expected Tajima D under the neutral model (D = 0).

