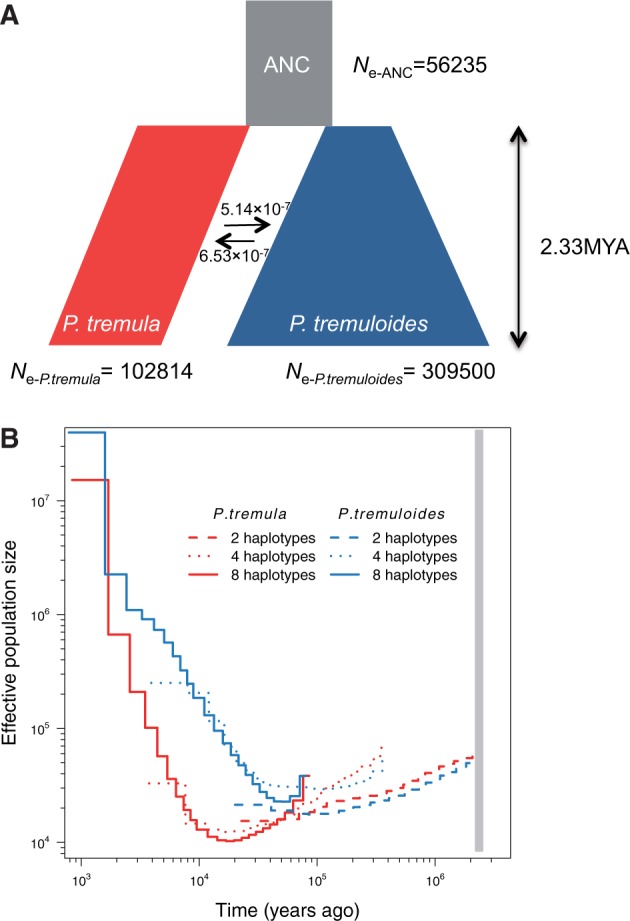
Fig. 2.

Demographic history of P. tremula and P. tremuloides. (A) Simplified graphical summary of the best-fitting demographic model inferred by fastsimcoal2. The ancestral population is in grey, P. tremula in red, P. tremuloides in blue, and their widths represent the relative effective population sizes (Ne). The arrows indicate the per generation migration rate (m) between P. tremula and P. tremuloides. The inferred demographic parameters are described in the text and shown in table 1 as well. (B) MSMC estimates of the effective population size (Ne) changes for P. tremula (red line) and P. tremuloides (blue line) based on the inference from two (dashed), four (dotted), and eight (solid) phased haplotypes in each species. Time scale on the x-axis is calculated assuming a neutral mutation rate per generation (μ) = 3.75 × 10⁻⁸ and generation time (g) = 15 years. The grey bar indicates the speciation time inferred by fastsimcoal2.
