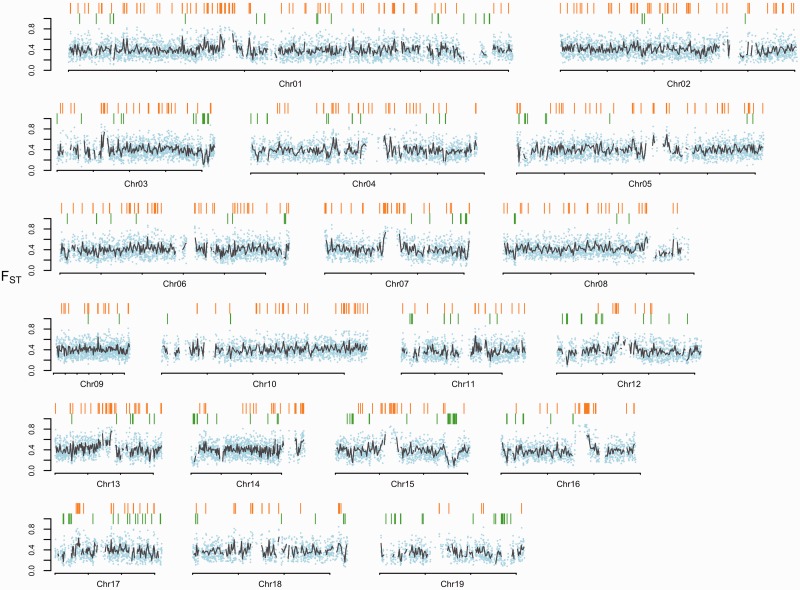
Fig. 3.
Genome-wide divergence. Chromosomal distribution of genetic differentiation (FST) between P. tremula and P. tremuloides. The small, light blue dots indicate FST values estimated over 10 kbp non-overlapping windows. Grey lines indicate FST values estimated over 100 kbp non-overlapping windows. Locations for windows displaying extreme differentiation relative to demographic simulations are highlighted with colored bars above the plot. Among them, outlier windows displaying significantly high differentiation (orange bars) are located on the topside; outlier windows displaying significantly low differentiation (green bars) are located at the bottom.

