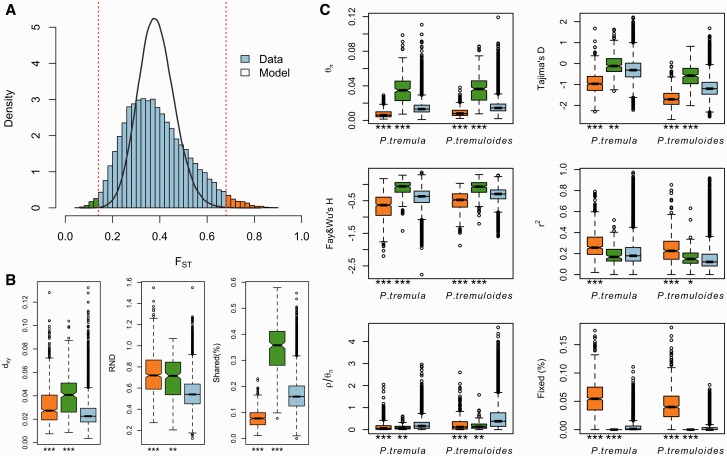
Fig. 4.
Identification of outlier windows that are candidates for being affected by natural selection. (A) Distribution of genetic differentiation (FST) between P. tremula and P. tremuloides from the observed (blue bar) and simulated datasets (black line). The dashed lines indicate the thresholds for determining significantly (FDR <1%) high (orange bars) and low (green bars) inter-specific differentiation based on coalescent simulations. (B) Comparisons of dxy, RND, and the proportion of inter-specific shared polymorphisms among regions displaying significantly high (orange boxes) and low (green boxes) differentiation versus the genomic background (blue boxes). (C) Comparisons of multiple population genetic statistics, nucleotide diversity (θπ), Tajima’s D, Fay & Wu’s H, LD (r2), recombination rate (ρ/θπ), the proportion of fixed differences caused by derived alleles fixed in either P. tremula or P. tremuloides, among regions displaying significantly high (orange boxes) and low differentiation (green boxes) versus the genomic background (blue boxes). Asterisks designate significant differences between outlier windows and the rest of genomic regions by Mann–Whitney U-test (* P value <0.05; ** P value <1e−4; ***P value <2.2e−16).

