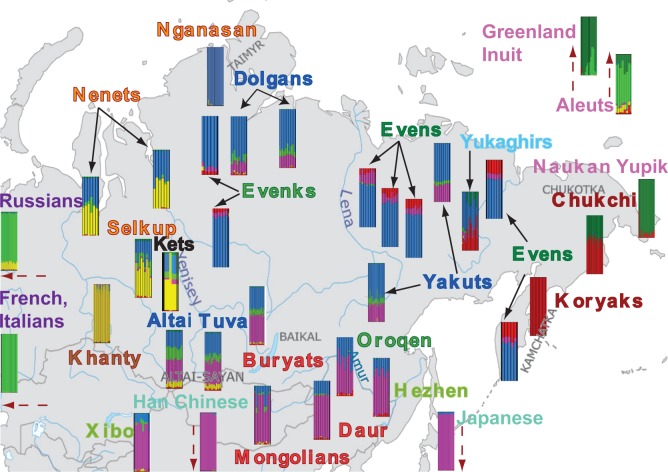
Fig. 3.
Admixture results for K = 6 showing the approximate location of the populations included in this study. The names of the populations are colored according to their linguistic affiliation as described in the legend to figure 2. Where two subgroups are from the same geographic location, only one of the subgroups is shown (full results are presented in supplementary fig. S5, Supplementary Material online). Note that for reasons of space the location of the two distinct Yakut subgroups does not correspond to their true location (which can be seen in supplementary fig. S1, Supplementary Material online). Each color indicates a different ancestry component referred to in the text as European, Western Siberian, Central Siberian, East Asian, Far Eastern, and Yupik-Inuit. Note that the assignment of geographic or population group labels to the genetic ancestry components should not be taken to mean that these populations constituted the actual source populations for the admixture events.

