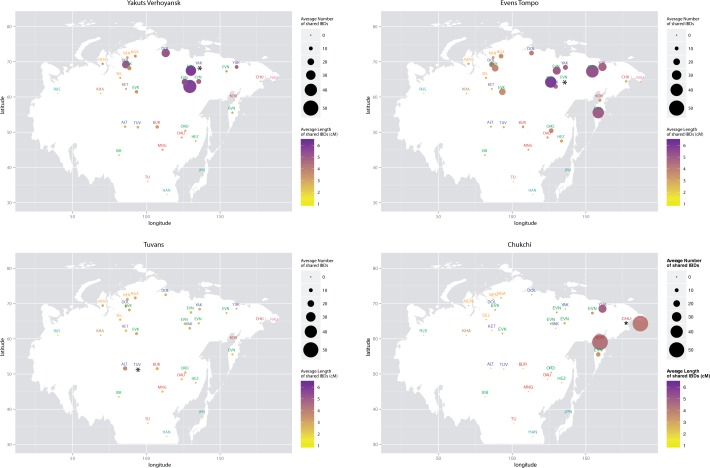
Fig. 5.
Recent relatedness as measured based on IBD blocks. Each data point represents the results for the comparison of the population marked with an asterisk to each of the other populations in the data set. Data points are placed on the map according to the sampling location of each population (geographic coordinates are listed in supplementary table S1, Supplementary Material online). Population labels are abbreviated to the first three letters of the population name, except EVN = Even; EVK = Evenk; MNG = Mongolian; JPN = Japanese. Each label is color coded according to the population’s linguistic affiliation as described in the legend to figure 2. The size of each circle is proportional to the mean number of IBD segments shared between the population marked with an asterisk and the population named in the label. The color intensity is proportional to the mean length of such shared IBD segments. Plots for the other populations can be found in supplementary fig. S12, Supplementary Material online.

