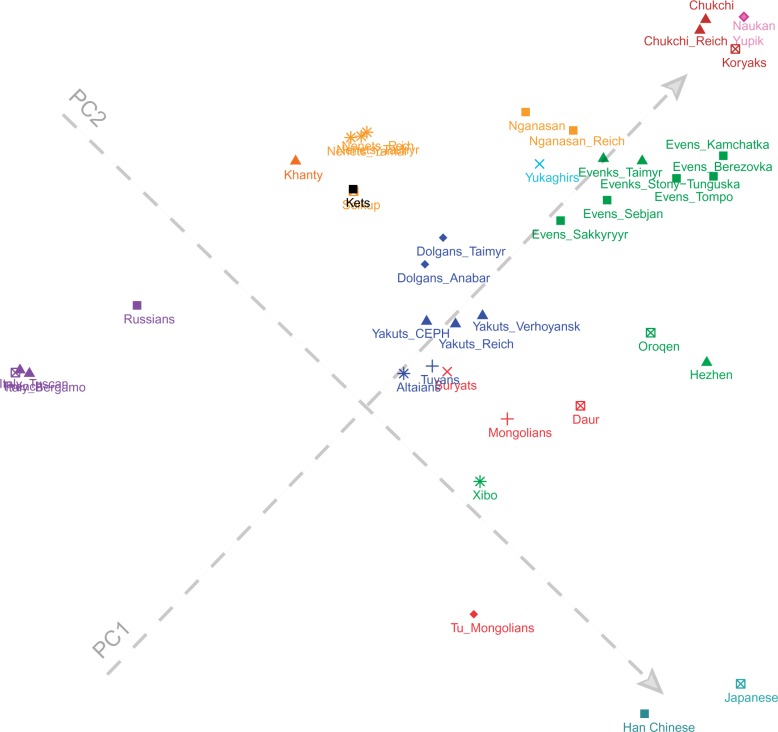
Fig. 6.
Results of the PC analysis based on the number of IBD blocks shared between populations. Each colored label represents a population, and color coding is according to linguistic affiliation, as described in the legend to figure 2. The PC axes are rotated for a better alignment with the geographic map of Siberia.

