
Fig. 5.
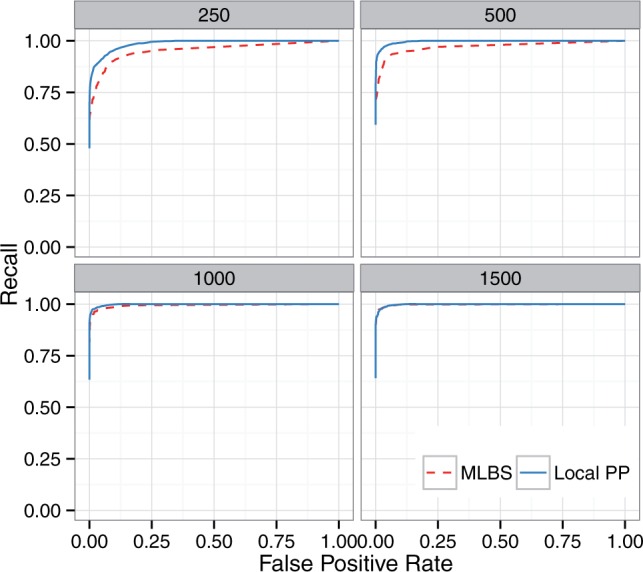
ROC curve for the avian dataset based on MLBS and local PPPP support values. Boxes show different numbers of sites per gene (controlling gene tree estimation error).
Official websites use .gov
A
.gov website belongs to an official
government organization in the United States.
Secure .gov websites use HTTPS
A lock (
) or https:// means you've safely
connected to the .gov website. Share sensitive
information only on official, secure websites.
ROC curve for the avian dataset based on MLBS and local PPPP support values. Boxes show different numbers of sites per gene (controlling gene tree estimation error).