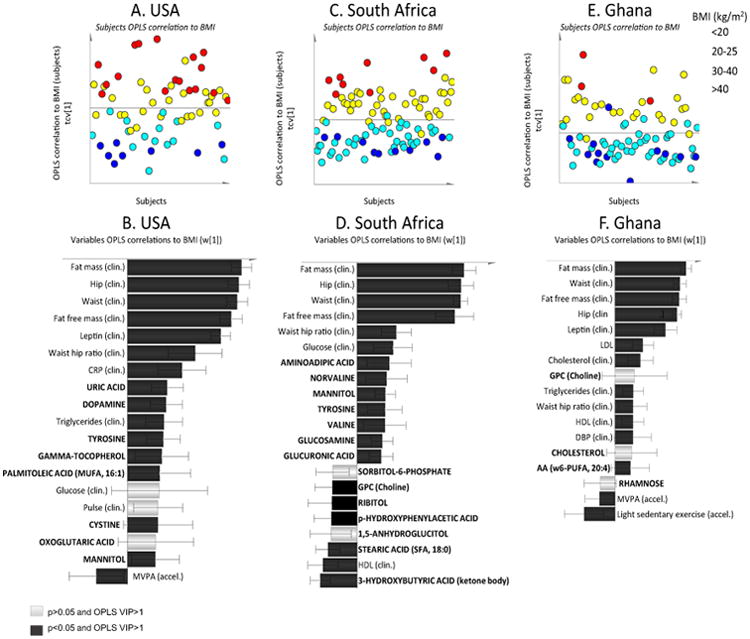
Fig. 1.

Three separate site-specific OPLS models describing metabolic profiles, i.e. plasma metabolites and clinical anthropometrics, associated with BMI in normal-weight and obese women. Variables/subjects with positive axis value have a positive correlation with BMI and variables/subjects with negative axis value have a negative correlation with BMI. Noteworthy, the axis values are OPLS correlations and cannot be interpreted as for example Pearsons correlations values. They are latent variables, thus the actual value can only be compared within each mode not between different models. Only identified metabolites with variables important to the multivariate model projection (VIP) value >1 are shown and variables are colored according to univariate significance level, i.e. black bars p < 0.05 and white bars p > 0.05. A complete list of all variables included in the OPLS models are listed in Supplementary Table 1. Subjects (plots below) are colored according to their BMI as described in the figure legend. US women revealed a clear BMI metabolite profile (a), which was mainly related to uric acid, amino acids, and lipids (plot b). South African women showed a robust metabolite profile related to BMI (plot c), where a high BMI was mainly related to alterations in amino acids and circulating sugars (plot d). Ghanaian women did not reveal a robust metabolite profile related to BMI (plot e). Among the circulating metabolites, only arachidonic acid was significant (plot e)
