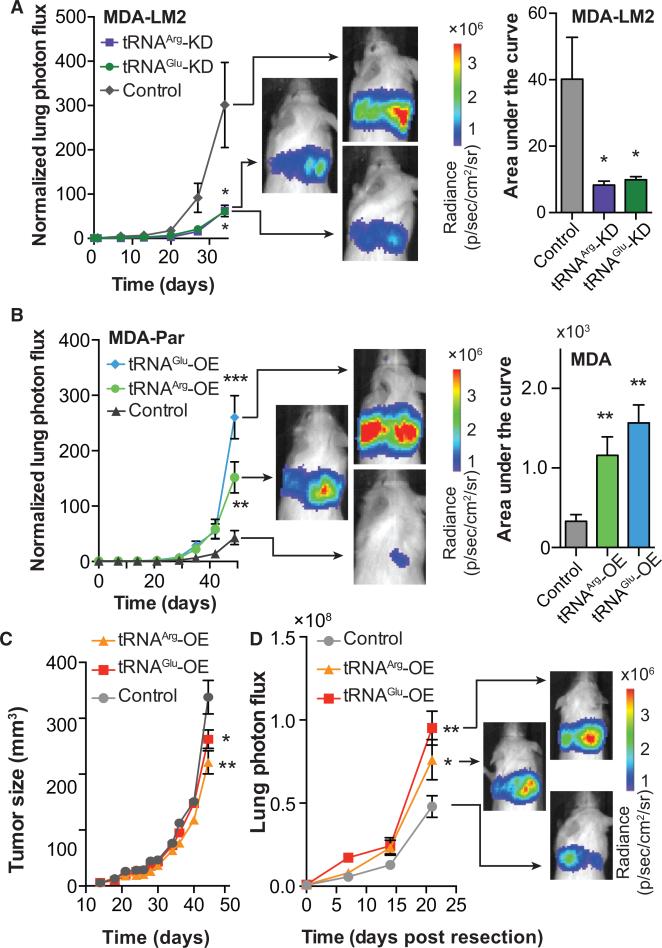
Figure 2. tRNAGluUUC and tRNAArgCCG Promote Metastatic Breast Cancer.
(A) Bioluminescence imaging plot of lung colonization by MDA-LM2 cells expressing short hairpins targeting tRNAGluUUC, tRNAArgCCG, or a control hairpin (shControl); n = 5 in each cohort. Area-under-the-curve was also calculated for each mouse.
(B) Bioluminescence imaging plot of lung colonization by tRNAGluUUC or tRNAArgCCG overexpressing lines, as compared to control in MDA-parental cells; n = 5 in each cohort. Area-under-the-curve was also calculated for each mouse.
(C) Primary tumor growth measurement after orthotopic injection of Control, tRNAGluUUC, or tRNAArgCCG overexpressing cells into the mammary fat pads of mice; n = 5 in each cohort.
(D) Orthotopic metastasis bioluminescence imaging plot of mice after primary tumor resection; n = 5 in each cohort. For comparing lung colonization, primary tumor growth, and orthotopic metastasis assays, two-way ANOVA was used to measure statistical significance. One-tailed Mann-Whitney test was used to measure statistical significance between the areas under the curves. Error bars indicate SEM. *p < 0.05, **p < 0.01, and ***p < 0.001.

