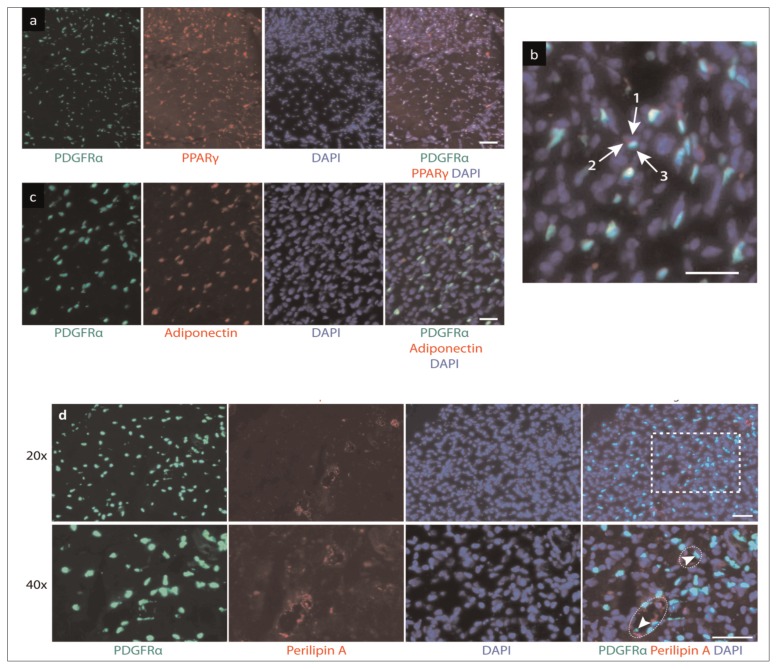
Figure 4.
Behavior of PDGFRα+ cells in fatty infiltration of muscle six weeks post-injury. Muscle sections were subjected to immunofluorescence staining for middle-stage adipogenesis marker PPAR-γ at (a) 20× and (b) 40x, scale bar: 25 μm; (c) late-stage adipogenesis marker adiponectin, scale bar: 50 μm; and (d) perilipin A, scale bar: 50 μm. Arrows in (b) indicate (1) nucleus, (2) PPAR-γ, and (3) PDGFRα. Circles in (d) highlight lipid droplets and arrowheads show PDGFRα signals within the fat cell. Dashed rectangle indicates area magnified at 40x.

