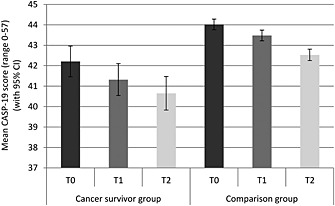
Figure 4.

Mean quality of life (with 95% confidence intervals) for each group at each time point (adjusted for age, sex and wealth)

Mean quality of life (with 95% confidence intervals) for each group at each time point (adjusted for age, sex and wealth)