
Figure 6.
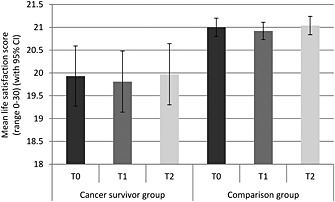
Mean life satisfaction (with 95% confidence intervals) for each group at each time point (adjusted for age, sex and wealth)
Official websites use .gov
A
.gov website belongs to an official
government organization in the United States.
Secure .gov websites use HTTPS
A lock (
) or https:// means you've safely
connected to the .gov website. Share sensitive
information only on official, secure websites.
Mean life satisfaction (with 95% confidence intervals) for each group at each time point (adjusted for age, sex and wealth)