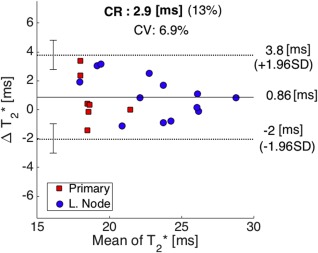
Figure 2.

Bland–Altman plot showing difference between median VOI in two scans against the mean value of for both visits (CR = coefficient of repeatability, CV = coefficient of variation). Mean difference (solid line) and 95% limits of agreement (dotted lines) are also shown, with corresponding 95% confidence limits (error bars).
