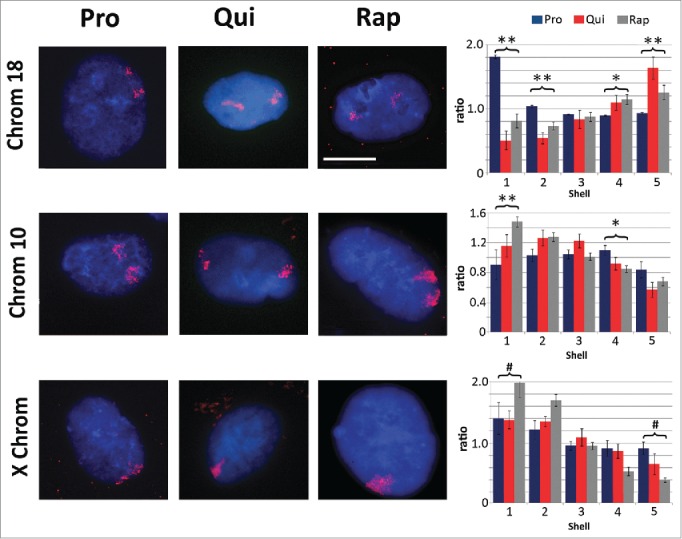
Figure 2.

Chromosome re-localization following rapamycin treatment and quiescence induction. Chromosomes 18 (top row), 10 (middle row) and the X chromosome (bottom row) were identified in proliferating (Pro, first column), quiescent (Qui, second column) and rapamycin-treated (Rap, third column) 2DD fibroblasts by chromosome painting. Red signal represents the identified chromosomes; chromatin was counter stained with H33342 (blue). Scale bar = 5 μm for all images. Following painting, erosion analysis was performed to designate the location of the chromosomes within the nuclear volume. Nuclei were broken into 5 concentric shells of area, shell 1 being most exterior and shell 5 being most interior. Graphs for each specific chromosome represents the measured ratio of % chromosome signal divided by the % H33342 signal in each shell (Y axis) to normalize for DNA content in each shell (X axis). Proliferative positioning is represented by blue bars, quiescent by red and rapamycin-treated in gray. Error bars = SEM. Two tailed Student's test for unequal variance were used to demonstrate significant difference in chromosome positioning. ** indicates that both proliferative and quiescent measurements had p values ≤0 .01. * indicates that only rapamycin had significant changes in chromosome positioning. # indicates a significant difference (p values ≤0 .01) between quiescent and rapamycin-treated samples. Correlation calculations were also performed to demonstrate if the trend in chromosome positioning was similar or divergent between the samples. Chromosome 18 Pro vs. Qui R2 = −0.83, Pro vs. Rap R2 = −0.99 and Qui vs. Rap R2 = 0.87. Chromosome 10 Pro vs. Qui R2 = 0.43, Pro vs. Rap R2 = 0.64 and Qui vs. Rap R2 = 0.95. X chromosome: Pro vs. Qui R2 = 0.84, Pro vs. Rap R2 = 0.98 and Qui vs. Rap R2 = 0.91.
