Figure 3.

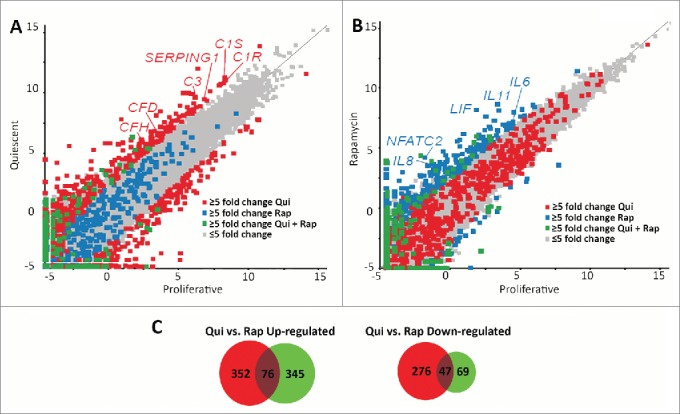
Scatter plots demonstrate different transcript profiles following quiescence induction or rapamycin treatment. Scatter plot comparing transcript abundance in quiescent and proliferating fibroblasts. The number of counts for each transcript identified by RNA-seq for proliferative (X axis) and quiescent (Y axis) fibroblasts was log-base-2 transformed with each square representing a single transcript. Transcripts exhibiting ≥5-fold increase and decrease in quiescent fibroblasts when compared to proliferative samples are marked in red (A). Gray squares represent transcripts that did not change abundance ≥5-fold. The number of counts for each transcript identified by RNA-seq for proliferative (X axis) and rapamycin-treated (Y axis) fibroblasts was log-base-2 transformed with each square representing a single transcript. Gray squares represent transcripts that did not change abundance ≥5-fold. Transcripts exhibiting ≥5-fold increase and decrease in rapamycin treated fibroblasts when compared to proliferative samples are marked in blue (B). Blue squares in panel A represent those transcripts that had a ≥5-fold increase and decrease in rapamycin treated fibroblasts and the red squares in panel B represent those transcripts that had a ≥5-fold increase and decrease in quiescent fibroblasts. Green squares in both panels represent transcripts that had a ≥5-fold increase or decrease under both quiescence induction and rapamycin treatment when compared to proliferative fibroblasts. Red or blue text highlights specific genes within each scatterplot. Venn diagrams demonstrating the number of genes up-regulated (left) or down regulated (right) from quiescent (red circles) or rapamycin-treated (green circles) fibroblasts in comparison to proliferating fibroblasts (C). Numbers in the overlapped areas indicate the number of genes changing expression in both quiescent and rapamycin treated fibroblasts.
