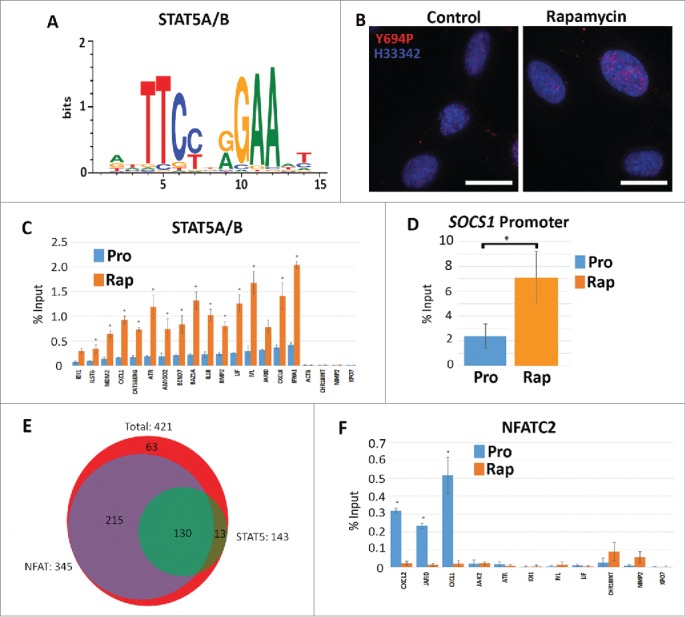
Figure 5.

Increased STAT5A/(B)promoter occupancy but not NFACT2 in genes upregulated in response to rapamycin. Using CLOVER, the promoters of genes that increased expression following rapamycin treatment were enriched in STAT5A/B transcription factor binding sites. Position weight matrix/sequence logo of this binding site is shown (A). Scale to the left represents the log-base-2 of the information content of each nucleotide and the bottom scale represents the position of those nucleotides within the binding site. Immuno-fluorescence for phosphorylated Y694-STAT5A/B (Y694P; red) in proliferating (Control) and rapamycin-treated (Rapamycin) fibroblasts (B). Chromatin is counterstained with H33342 (blue). Scale bar = 10 μm. ChIP assays were used to compare promoter occupancy of STAT5A/B in proliferative (Pro/blue) and rapamycin treated (Rap/orange) samples (C). Promoters analyzed are given (X-axis) and the percent enrichment over input reported (Y-axis). For all ChIP assays, error bars represent the SEM and * indicate significant enrichment with p-values from one tailed t-tests ≤0 .05. ChIP assays for STAT5A/B promoter occupancy in the promoter of the SOCS1 gene under proliferative (Pro) and rapamycin treatment (Rap) (D). Venn diagram indicating the number of genes up-regulated by rapamycin (red; 421 genes) that shared STAT5A/B (green; 143 genes) and NFAT (purple; 345 genes) binding sites (E). ChIP assays were also performed for NFATC2 promoter occupancy. Proliferative (Pro/blue) and rapamycin treated (Rap/orange) samples were compared. Promoters analyzed are given at the bottom and the percent enrichment over input reported (F).
