
Figure 6.
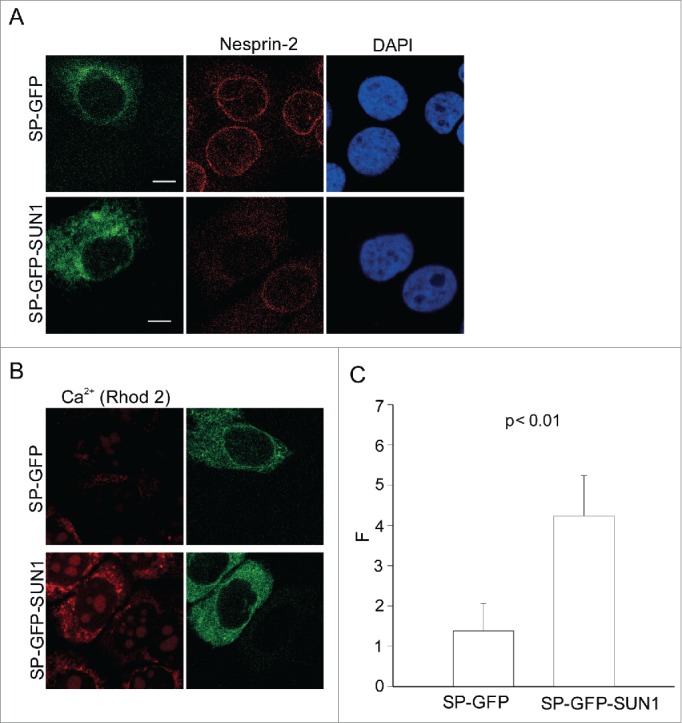
Ca2+ imaging in cells expressing SP-GFP-SUN1-C. (A) Effect of SP-GFP-SUN1-C polypeptide interfering with Nesprin localization in a dominant manner. HaCaT cells were transfected either with control SP-GFP plasmid or SP-GFP-SUN1-C plasmid. Immunofluorescence analysis was performed using pAbK1 Nesprin-2 antibodies and DAPI. (B) Representative image of live transfected cells loaded with Rhod-2. (C) Quantitative comparison of fluorescence measurements in the transfected cell lines (F: corrected Rhod-2 fluorescence intensity): The values represent mean and SD of 3 independent experiments (p value, 0.0021). 50 cells were analyzed.