
Figure 2.
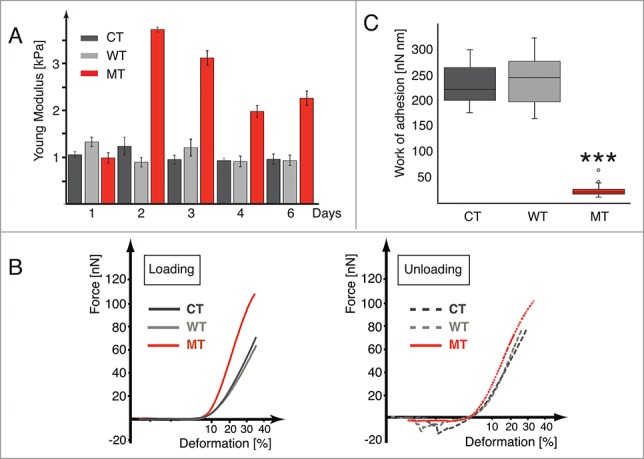
LMNA D192G mutation alters the nuclear and cellular biomechanics. (A) Bar graph indicating the Young modulus values for Control (CT, dark gray), wild-type (WT, light gray) and Mutant (MT, red) cells after 1 to 6 days from the infection (bars indicate SE, corresponding data and statistical significance in Table 1). (B) Examples of loading-unloading AFM curves for CT, WT and MT cells, respectively. (C) Box plot data of the work of adhesion, for the CT, WT and MT NRVMs, respectively, ***p < 0.0005 between MT and both CT and WT.